Wrap Up for ESH
This is the wrap up for the HMI Display for the ESH project.
Things I still need to figure out.
- Alarms
- Setting up alarms.
- Click on Configure -> Alarm Points
- Create an alarm point.
- Set up the LowLow Low Normal High and HighHigh values for the alarm.
- This is where you can enable and disable alarms.
- Double click on the Alarm window.
- Add the alarm points to the Alarm window the Ref Count should increase for each alarm point added.
- Click on Configure -> Alarm Points
- How to enable and disable alarms from the windows apart from the functionality that already exists in the Menu.
- Highs and lows what should trigger an alarm (Water Quality)
- Look at Alarms page for alarms.
- Sending out Emails for Alarms is possible we are going to be talking to Jake about how to set up the Emails.
- Setting up alarms.
- What additional files does Camile run.
- There is a system file folder
  1. Sunrise Sunset information.
     1. CSV's with the Sunrise and Sunset information.
     2. The way to do this is a recipe file according to Julio since there is no recipe file I am assuming that it was done in Camile. I plan on looking into recipe files and figuring out how to send the data using a recipe file to the Control tag.
  2. OPC config files they have the .ocf type. current files is EPA_StreamsJuly2021.ocf
  3. Modbus config file they have .mcf type. Current file is YSI_MAY2023.mcf
     1. I have asked Jeremy a couple of questions about the Modbus.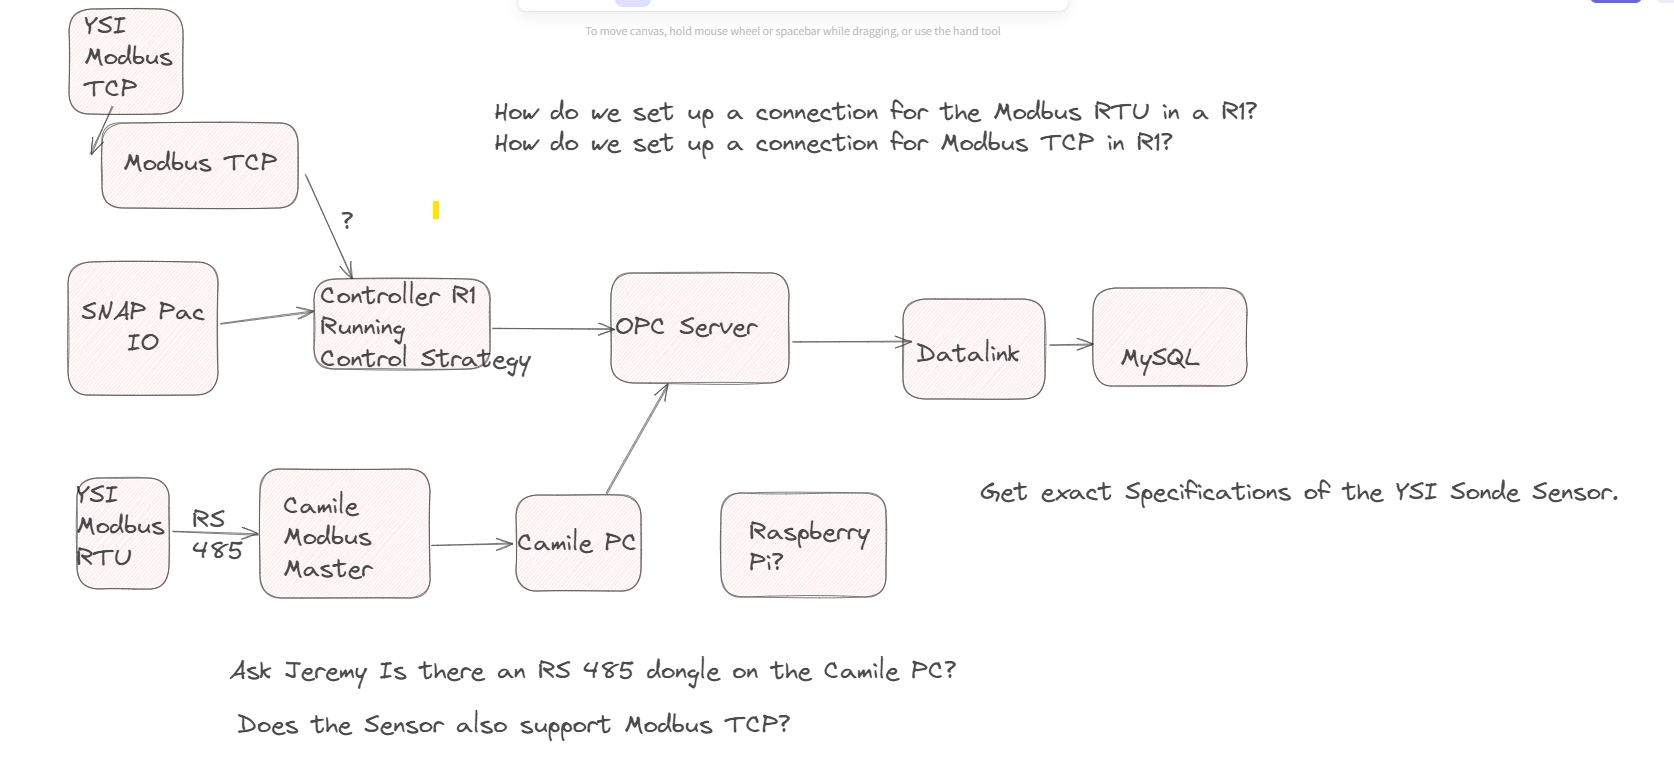
- Does the control file actually import the values or has Camile been handling it.
- There is a system file folder
- Control Code Menu Disposition
- Flow Control
- Values that are displayed on this page only.
- Return Flow
- River Water level DI
- What does CB stand for? There are CB tags they look like processes in the controller pages Make sure they are not needed.
- Values that are displayed on this page only.
- RO System
- Values that are displayed on this page only.
- RO Product Flow
- RO Product Pump AO
- Scour Pump Flow
- Scour Pum AO
- Scour Pump Flow
- PV and SP
- Values that are displayed on this page only.
- Weather
- Values that are displayed on this page only. Either rain gage or rainfall amount is likely Precipitation which is on the overview page.
- Rain gage
- Rainfall amount
- Sunrise Shows up on Lighting page
- Sunset Shows up on Lighting page
- Values that are displayed on this page only. Either rain gage or rainfall amount is likely Precipitation which is on the overview page.
- Water Quality
- This page has water quality for stream 4.2 and 8.2.
- Probe Location for all the streams water quality. Look in Camile Manual on monday for Probe Location?
- Device Drivers
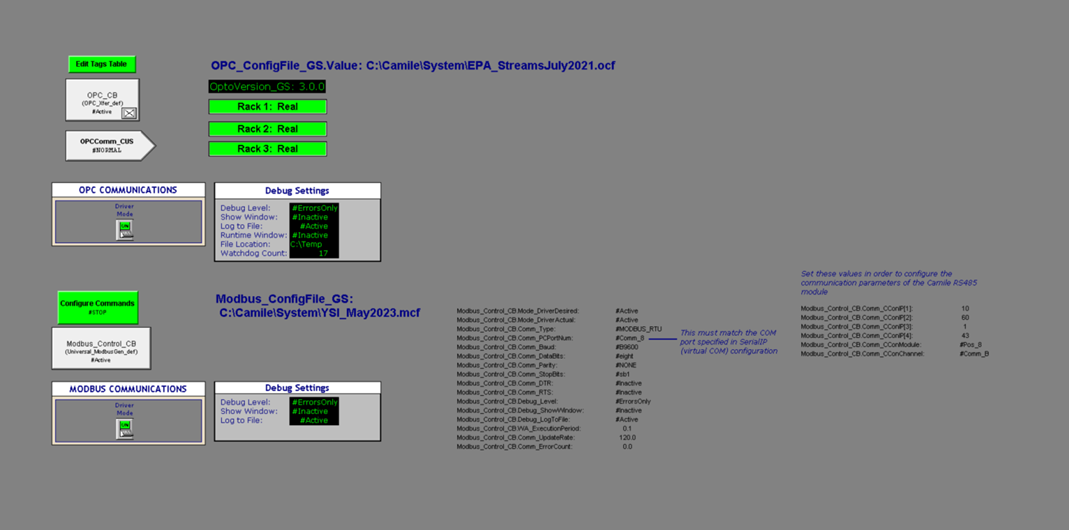 Since we are using Opto for everything some of the tags will not be needed anymore If we keep this page around it should have. What should we document on it?
 - Power Drops
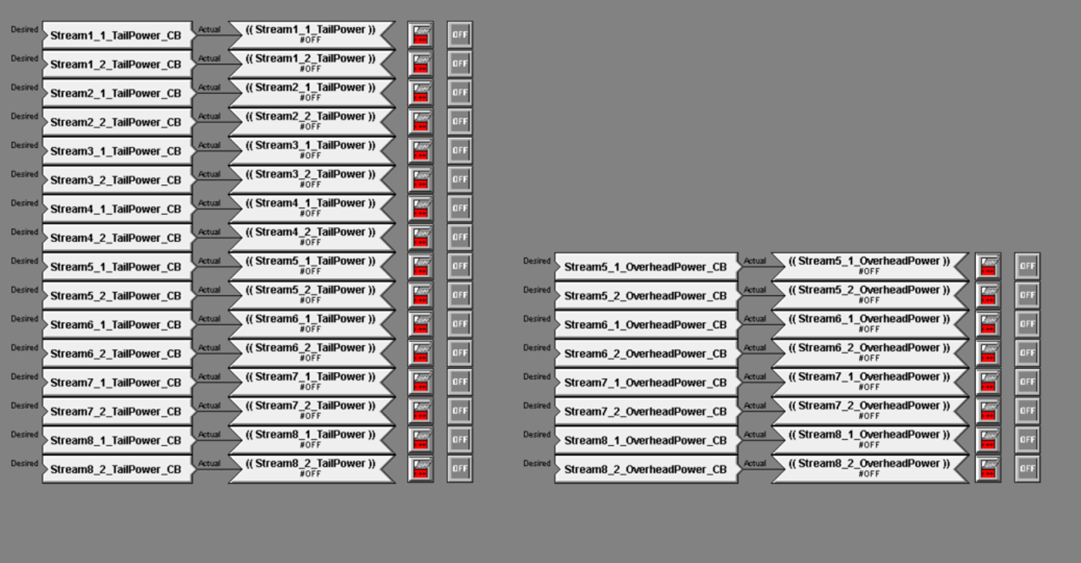
- This is covered in the Stream pages. It is the ability to turn on and off Tail power and Overhead Power.
- Again unless CB is important.
- Messaging
- This is sending out alarm messages. Alarms in pac display pro handles sending out emails.
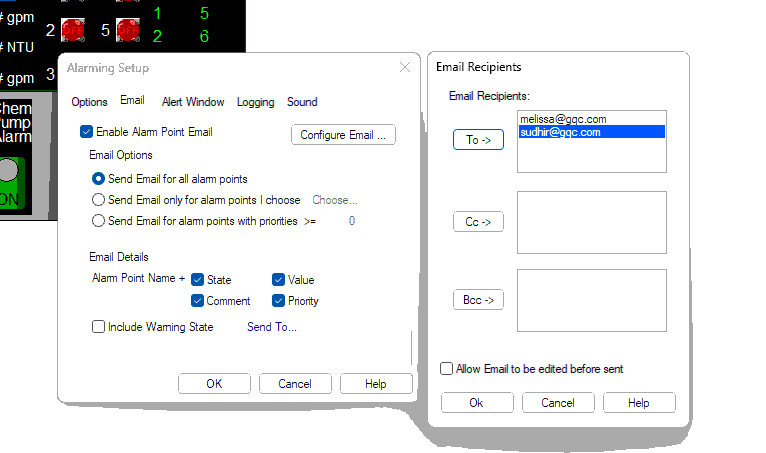
- This is sending out alarm messages. Alarms in pac display pro handles sending out emails.
- Alarms page
- This would be handled by alarms. The current plan is to have an alarms page.
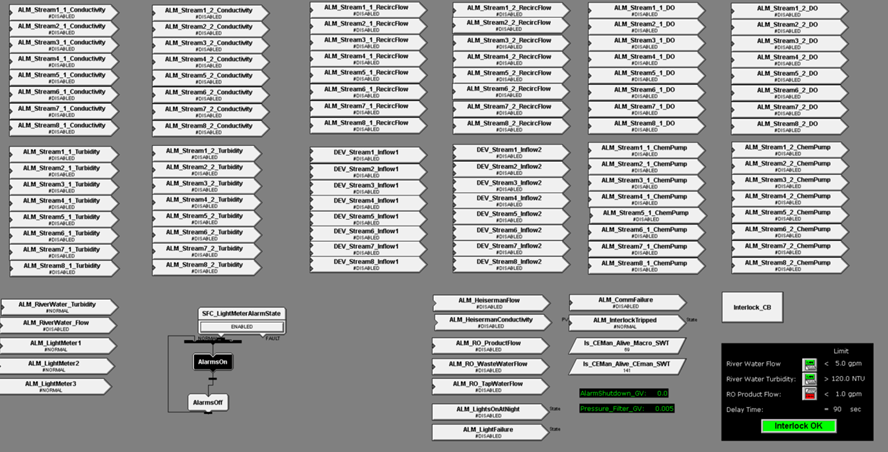
- Delay time
- Product Flow is on RO page. So we can likely skip it here. Other switches are on overview page.
- This would be handled by alarms. The current plan is to have an alarms page.
- Jeremy said he never used the Hydrograph page. From what he said it was used 1 time during a test.
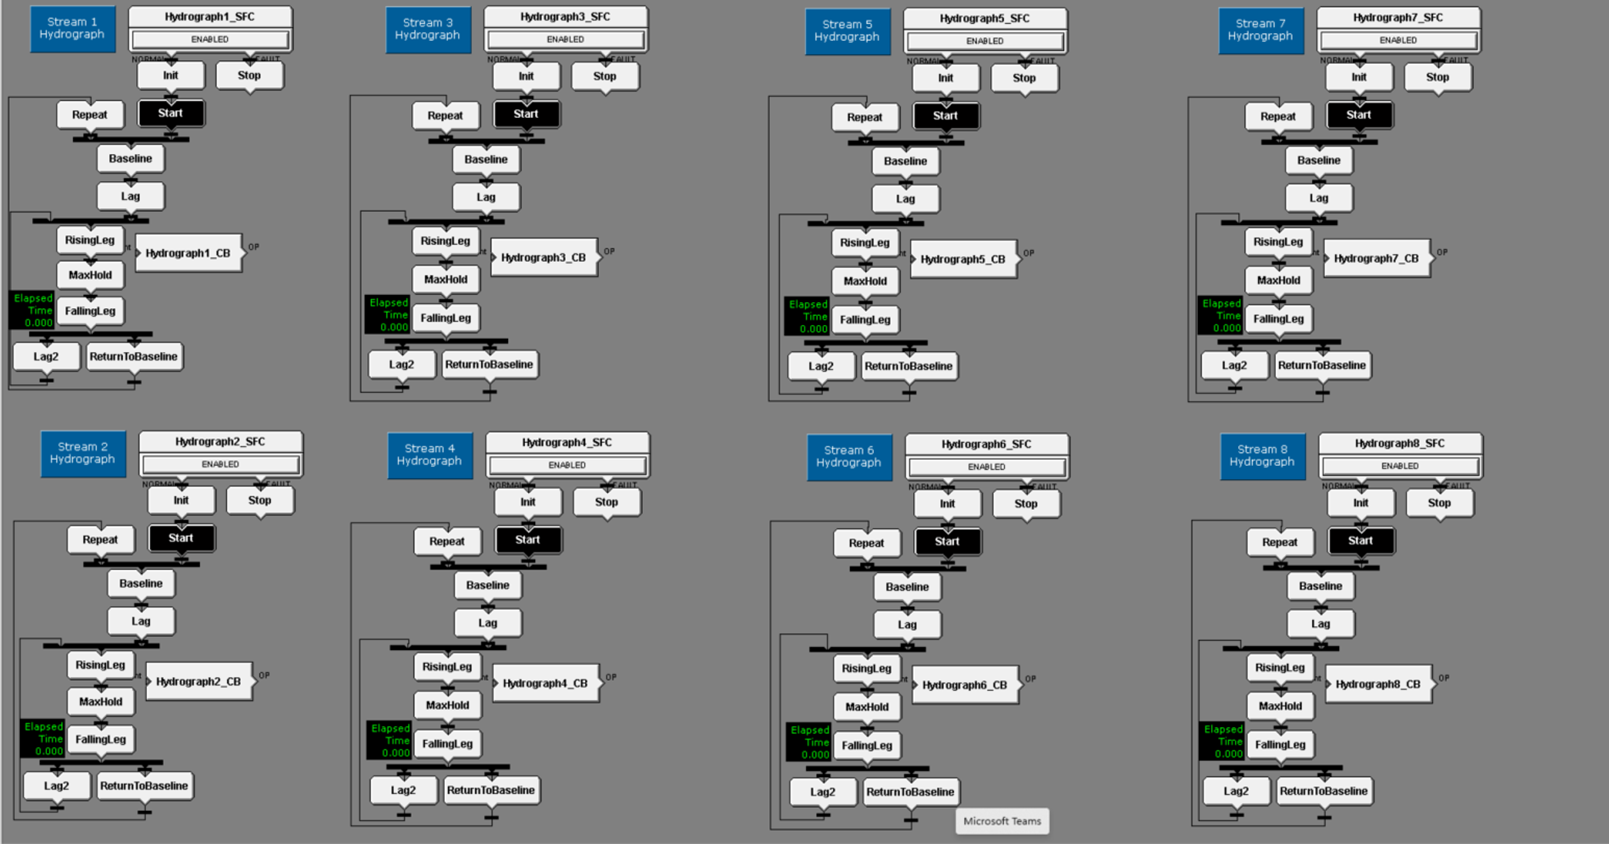 I need to send an email to Jeremy to get documentation and then we can cut it.
- Flow Control
Priority Order
- Finish the Top Overview page. Get the Enable and disabled working on lights and things like that.
- Finish Stream 1 on the Overview page So I can fill out the rest of the overview page.
- [ ]Ask Jake's advice on the valve image.
- [ ]Finish Stream Pages.
- Most of the tags are known from overview so it is easy.
- Finish Trend graphs pages.
- Start with control pages.
All Items
- Template work
- Create all the windows.
- Program the Navigation Bar template.
- Put Navigation bar on all the pages.
- Overview Page
- Alarms
- Look at Tricks and tips section for pac display pro https://www.opto22.com/support/resources-tools/videos/video-pac-display-tips-and-tricks
- Messaging for alarms.
- Enable and disable alarms using buttons and switches.
- Light Meter Alarms
- Chem Pump Alarms
- Water Quality Alarms
- Finish Stream 1
- Set points need to be set up.
- Inputs for Pressure alarm Limit needs to be added
- Stupid Valve image. I plan on asking Jake his opnion
- Functionality valve shape that changes color based on something I have no idea what tag I need to assign to it.
- Fill in Streams
- Copy Stream 1 and reprogram it (This means change the tags) for 2-8.
- System Row
- Inputs for RO System Speed
- Interlocks
- DO Delivery Pump.
- Reset Interlocks
- River Fow inputs and on off button
- River Turbidity Input and on off button
- Ro Flow input and on off button
- Lights in use buttons
- Grow Lights Display
- Alarms
- Stream Pages
- Finish the Stream 1 page.
- I mostly have it set up but not programmed It needs to be programmed.
- After it's programmed I may have questions for Jeremy.
- Like what is OP[%], Mode, and Manual OP[%]
- Power Drops buttons.
- Copy the Stream 1 page and reprogram it up for streams 2-8.
- Finish the Stream 1 page.
- Trend Graphs
- I have started the Trend graphs
- Stream 1 trend graphs that represent 1 day – 7day – 28day snapshots
- Stream 2 trend graphs that represent 1 day – 7day – 28day snapshots
- Stream 3 trend graphs that represent 1 day – 7day – 28day snapshots
- Stream 4 trend graphs that represent 1 day – 7day – 28day snapshots
- Stream 5 trend graphs that represent 1 day – 7day – 28day snapshots
- Stream 6 trend graphs that represent 1 day – 7day – 28day snapshots
- Stream 7 trend graphs that represent 1 day – 7day – 28day snapshots
- Stream 8 trend graphs that represent 1 day – 7day – 28day snapshots
- Cond
- Do
- pH
- ORP
- Temp
- Turbidity
- Inflows
- Recic Flow
- Chem Pumps
- Nitrate
- I have started the Trend graphs
- Lights We Need to keep this page.
- Values that are displayed on this page only.
- Light Switches for Grow Lights
- Note: there is enabled and disabled grow lights we have an indicator for if the grow lights are on but no switches on the Overview page.
- Sunrise Sunset Timesync
- Lighting on interval
- Lighting off interval
- Lights in Use
- Step Num
- 2 Charts one for lights and one for Grow Lights.
- Light Switches for Grow Lights
- Values that are displayed on this page only.
- Flow Control
- RO System
- Weather
- Water Quality
- Device Drivers
- Power Drops
- Messaging
- Alarms page
- Hydrograph
- Export functionality.
- We will be making a backup of the MySqlServer using datalink.
- We will be showing them how to use configure a ODBC Driver.
- Connect to power bi
- Connect to Excel Excel.