RSMS HDF5 files
There are 3 files that are generated by the HEC-RAS project.
- g hdf - Geometry
- p hdf - Plan
- u hdf - Unsteady
After reviewing the above files I have not been able to find River Miles or Lat Longs for the data.
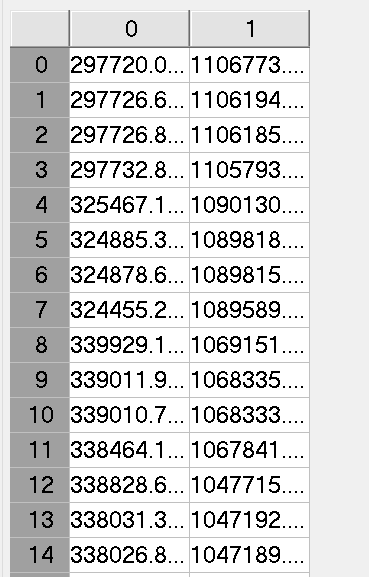
There are a few HDF files that seem to be coordinates but I do not know the projection
According to the internet it can have both river miles and Lat Longs but you have to set that in HEC-RAS.
According to Chat GPT this is how you would go about making sure it has River mile and Lat Longs.
- Ensure Geo-Referencing in HEC-RAS Using RAS Mapper Open RAS Mapper: Open your HEC-RAS project and go to RAS Mapper from the main HEC-RAS interface. Set Projection: In RAS Mapper, go to Tools -> Set Projection for Project. Choose the appropriate coordinate system (e.g., UTM, State Plane, etc.). Importing Geo-Referenced Data Import Terrain and GIS Data: Add your terrain data in RAS Mapper. Import GIS data for river networks, cross-sections, and other features. Ensure these data layers are geo-referenced.
- Include River Mile Data Define River Stations: When setting up your cross-sections in the Geometry Data editor, ensure that you correctly enter the stationing data (river miles) for each cross-section.
- Run Simulations Run your simulations as usual. HEC-RAS should now include the geo-referenced information in the output HDF5 file.
- Check HDF5 Output for River Mile and Lat/Long Data Verify the HDF5 File: Use the script provided earlier to verify the presence of river mile and latitude/longitude data in the HDF5 file.
Getting Lat Long from projected map data.
We have been able to get the projection data out of the Geometry section of the P HDF5 file. With this as well as the projection we can transform this into Lat Long. We can do something similar with a shape file that that has river mile something we were able to find with Delaware. This will give us the data we need for the RMI file and table.
import h5py
import geopandas as gpd
import pandas as pd
from shapely.geometry import Point
import folium
import pyproj

# File path to the HDF5 file
file_path = 'C:/Project/HydroTrek/RSMS/Delaware/2024/Flow_Data/Simulations_June_4_data/Simulations/Combined_Delaware.p18.hdf'

# Read the HDF5 file and extract the coordinates
with h5py.File(file_path, 'r') as hdf:
    # Assuming the coordinates are stored in a dataset named 'coordinates'
    # Adjust the dataset name and structure as per your file
    projected_coords = hdf['Geometry/River Centerlines/Polyline Points'][:]

# Define the coordinate system (NAD 1983 State Plane New Jersey)
proj_str = """
    PROJCS["NAD_1983_StatePlane_New_Jersey_FIPS_2900_Feet",
    GEOGCS["GCS_North_American_1983",
    DATUM["D_North_American_1983",
    SPHEROID["GRS_1980",6378137,298.257222101]],
    PRIMEM["Greenwich",0],
    UNIT["Degree",0.017453292519943295]],
    PROJECTION["Transverse_Mercator"],
    PARAMETER["False_Easting",492124.9999999999],
    PARAMETER["False_Northing",0],
    PARAMETER["Central_Meridian",-74.5],
    PARAMETER["Scale_Factor",0.9999],
    PARAMETER["Latitude_Of_Origin",38.83333333333334],
    UNIT["Foot_US",0.30480060960121924]]
"""

# Define the CRS objects using pyproj
proj_projcs = pyproj.CRS(proj_str)
proj_latlon = pyproj.CRS("EPSG:4326")  # WGS 84

# Create a GeoDataFrame with the projected coordinates
gdf_proj = gpd.GeoDataFrame(
    {'geometry': [Point(x, y) for x, y in projected_coords]},
    crs=proj_projcs
)

# Convert the GeoDataFrame to WGS 84
gdf_latlon = gdf_proj.to_crs(proj_latlon)

# Print the converted coordinates
print("Converted coordinates (latitude, longitude):")
for point in gdf_latlon.geometry:
    print((point.y, point.x))


# Extract latitude and longitude from the GeoDataFrame
latlon_coords = [(point.y, point.x) for point in gdf_latlon.geometry]

# Write the converted coordinates to a CSV file
df = pd.DataFrame(latlon_coords, columns=['Latitude', 'Longitude'])
df.to_csv('converted_coordinates.csv', index=False)

# Create a map centered at the first converted coordinate
m = folium.Map(location=[gdf_latlon.geometry.y[0], gdf_latlon.geometry.x[0]], zoom_start=10)

# Add the converted coordinates to the map
for point in gdf_latlon.geometry:
    folium.Marker(location=[point.y, point.x]).add_to(m)

# Save the map to an HTML file
m.save("map.html")

print("Map has been saved to map.html")