Tasklist
DWD
- Quality Map
- This should be "Dropdown space for J-494"
- Species should be changed to Quality
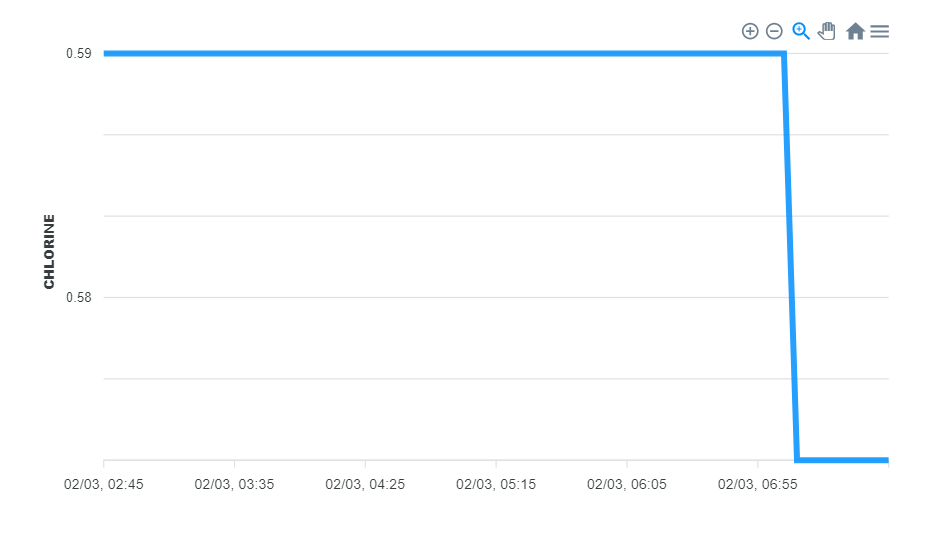
- Time should be the x axis lable
- Y axis should be Chlorine units.
- Add in a slider into here that will work with Slider on the outside.
- Options do not work we wanted to turn on and off Junctions, tanks, ...
- We would also like to implement something so that we can updated color of pushpins/lines based on a a value.
- We are currently coloring on type.
- Tank
- Junction
- Reservoir
- Pump
- Pipe
- Valve
- Pump and valve are hard to see given we are using a Link that lines up with pipes. Talk to Jake.
- Hydralic Map
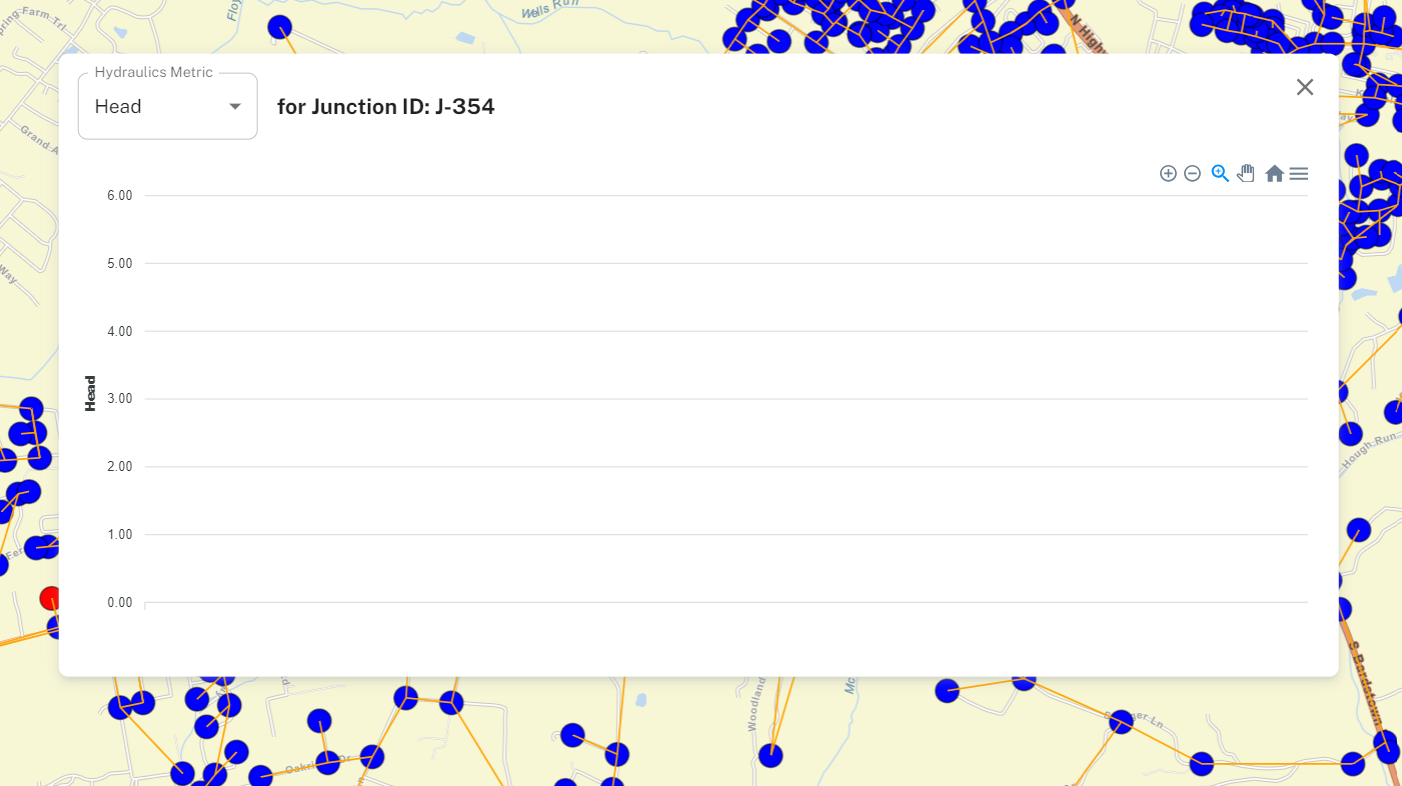
- The GQC Model should be used.
- The Chart needs to be updated to same chart in Quality.
- 1, 2, and 3 of Quality Map will need to be implmented.
- Model Hydralic Summary
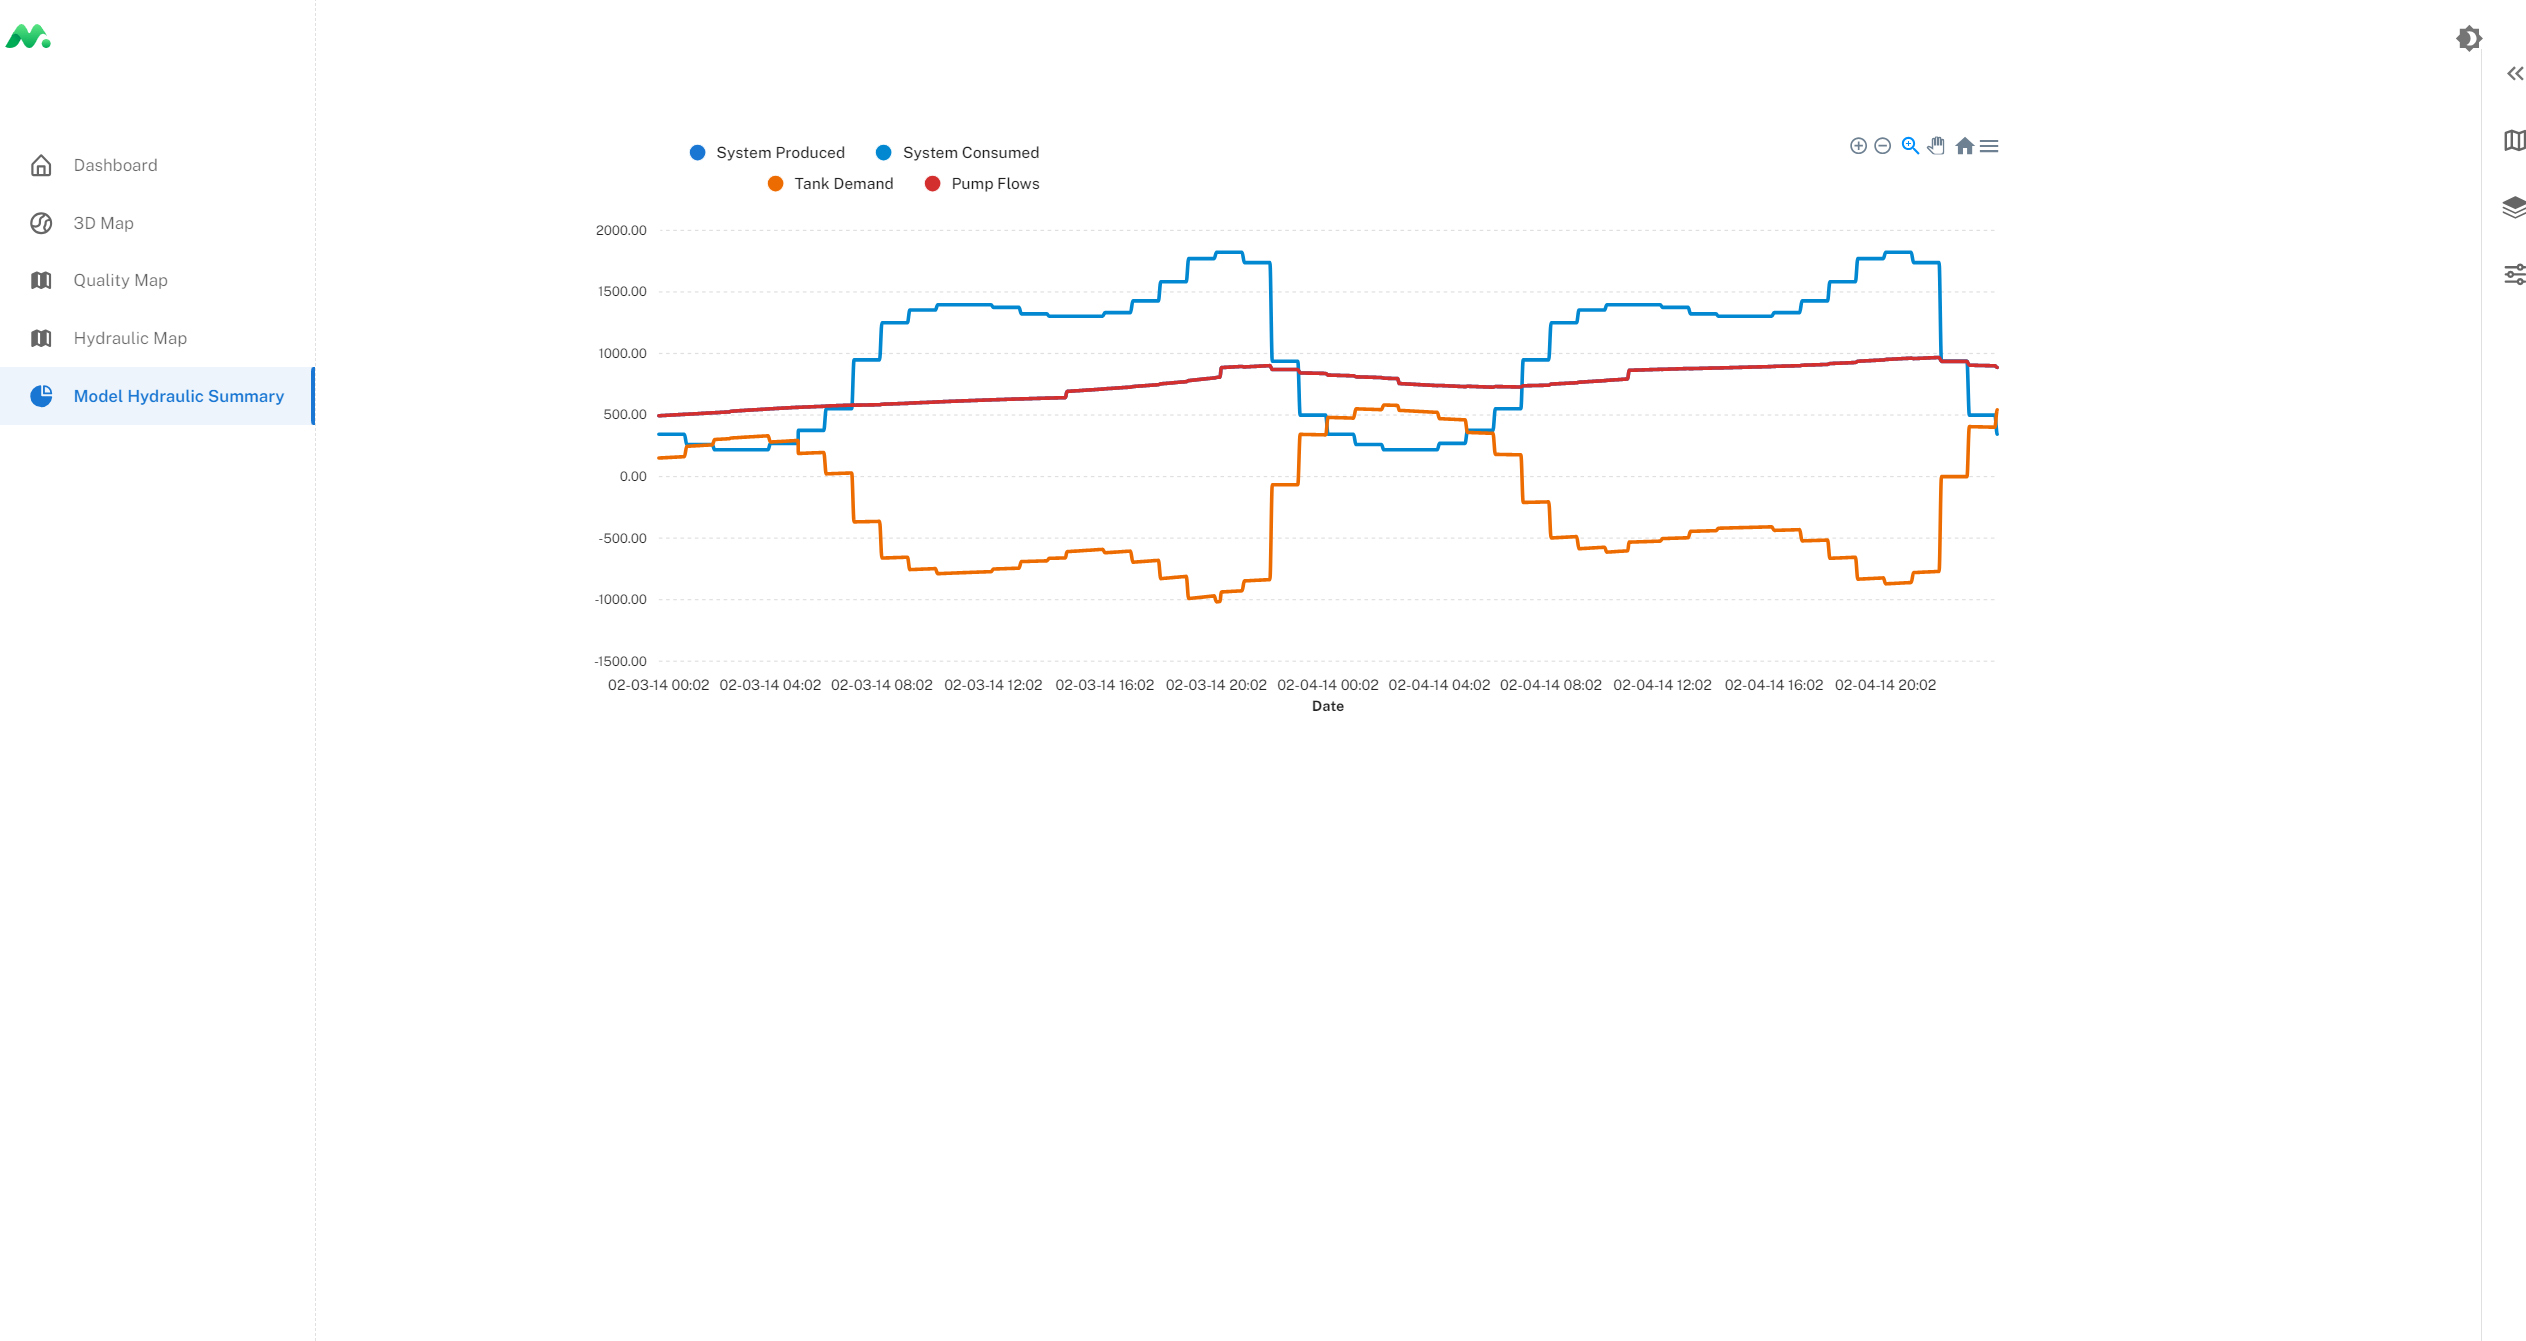
- The graph is not taking up the entire page.
- Nothing in the Left panel works.
- Nav issues


- Using M for minimal in the Demos.
- Not having a Hamburger menu like SWMM.
SWMM
- Overiew Page
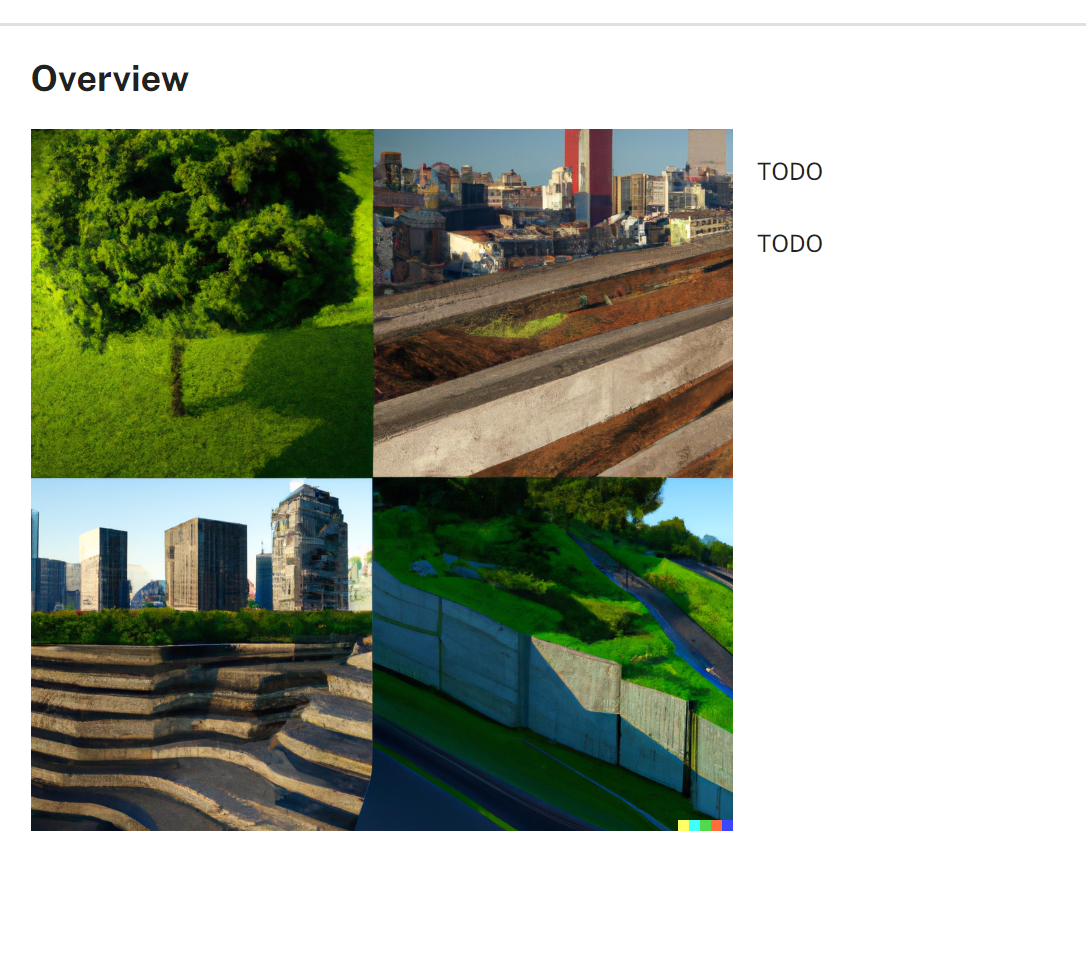
- Keep it consistent call it Dashboard.
- We have images we need to add text use the one pagers for content.
- Scenarios Page
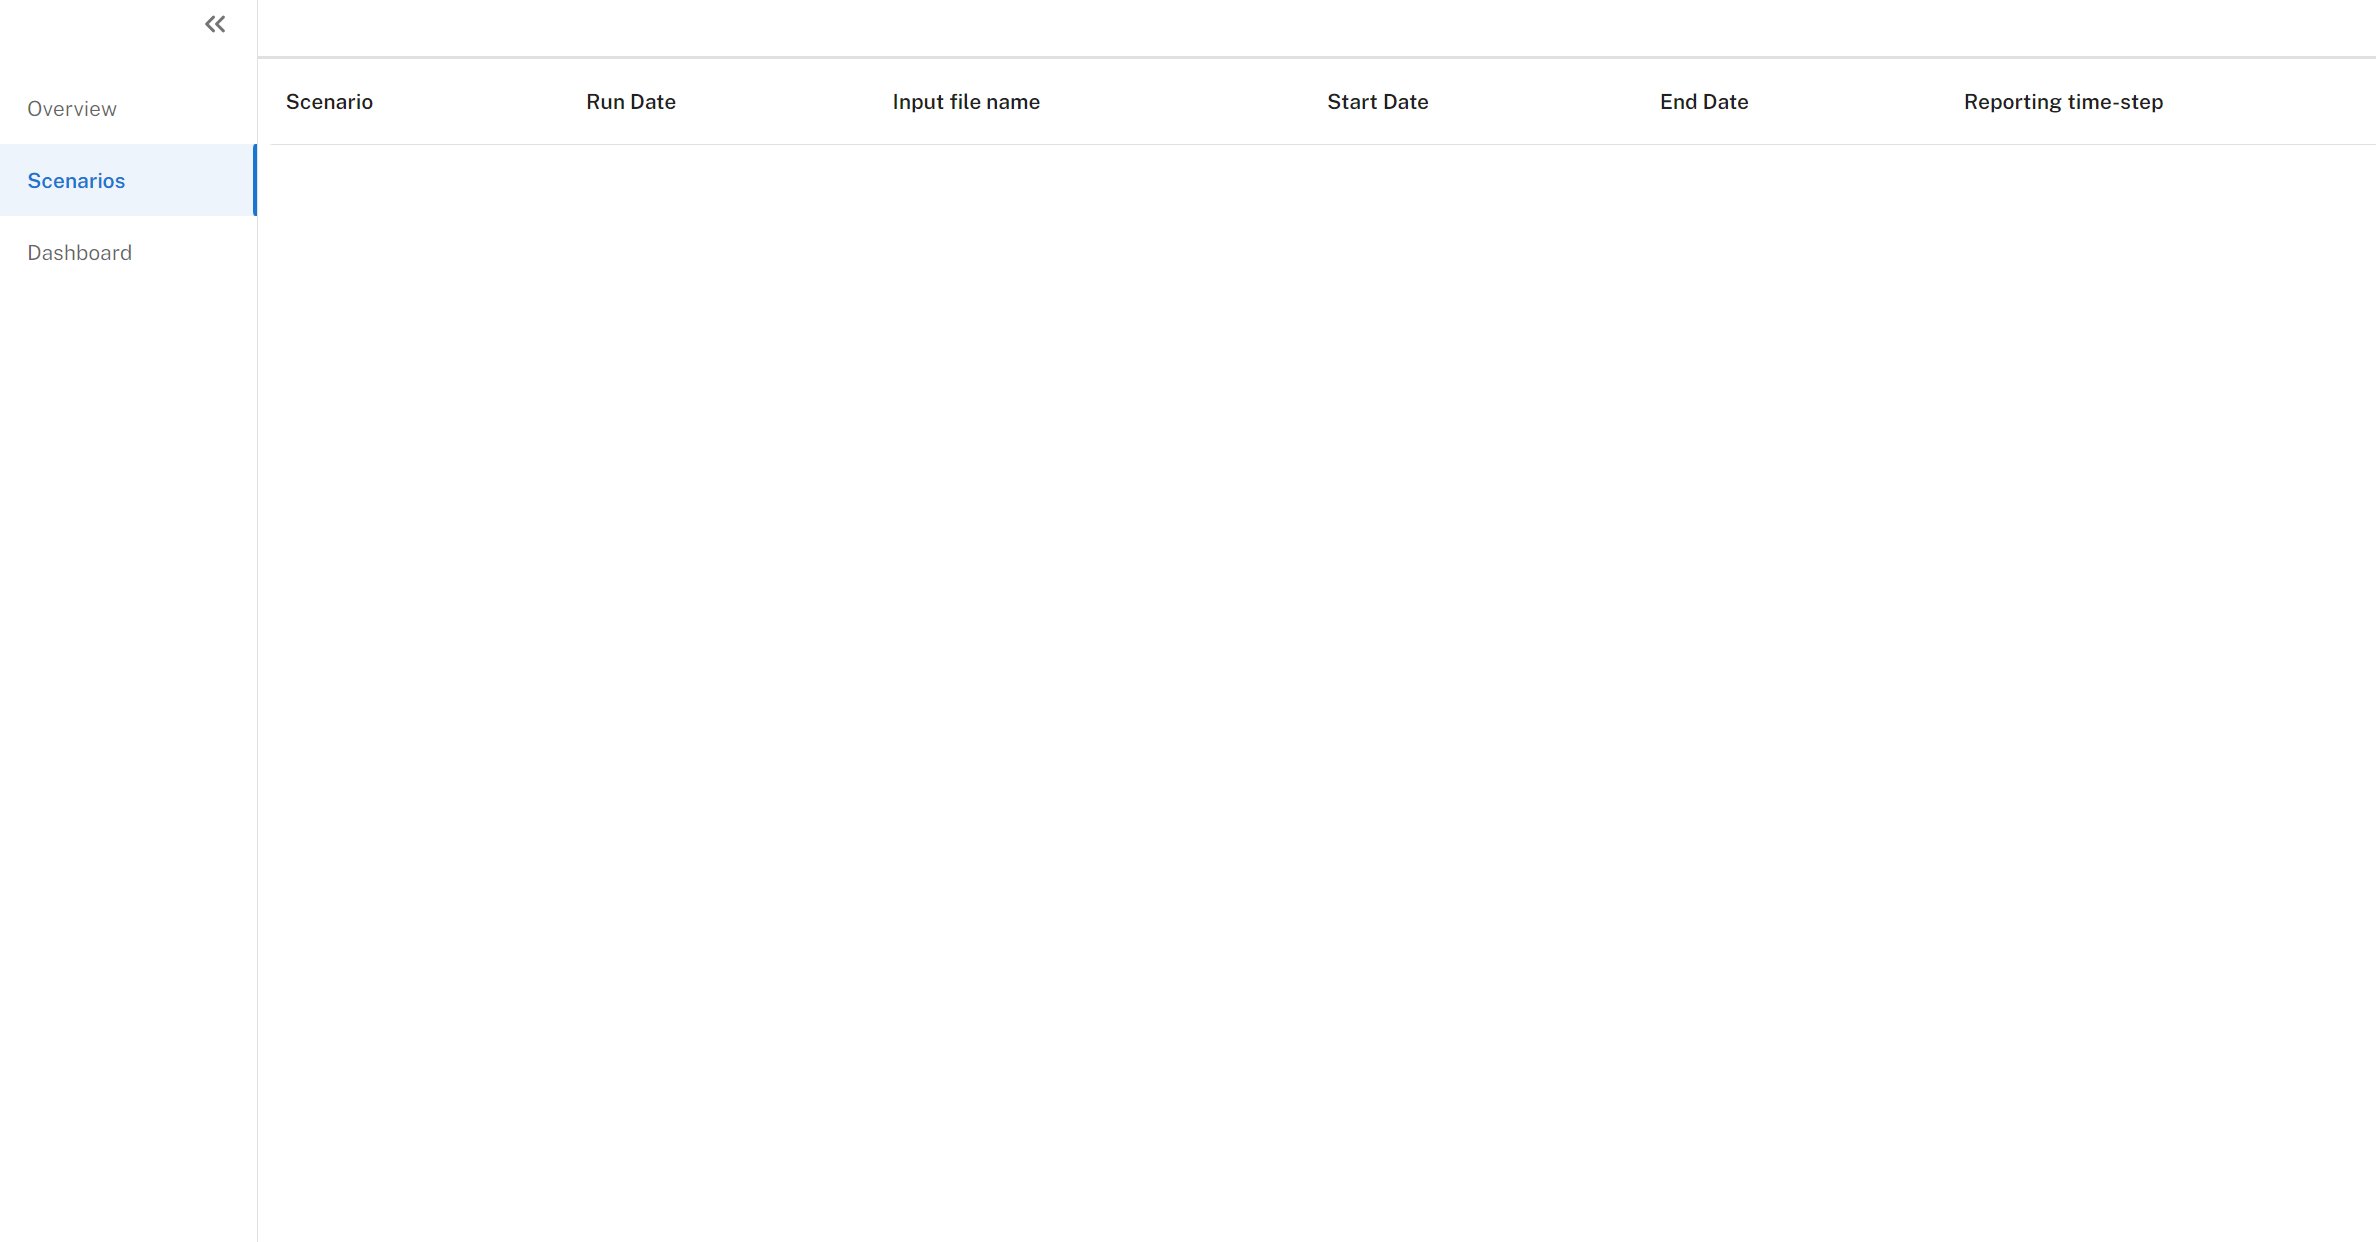
- Scenarios can take a long time to load can we get some kind of Loading image (never ending circle icon) We have this on the chart on the next page.
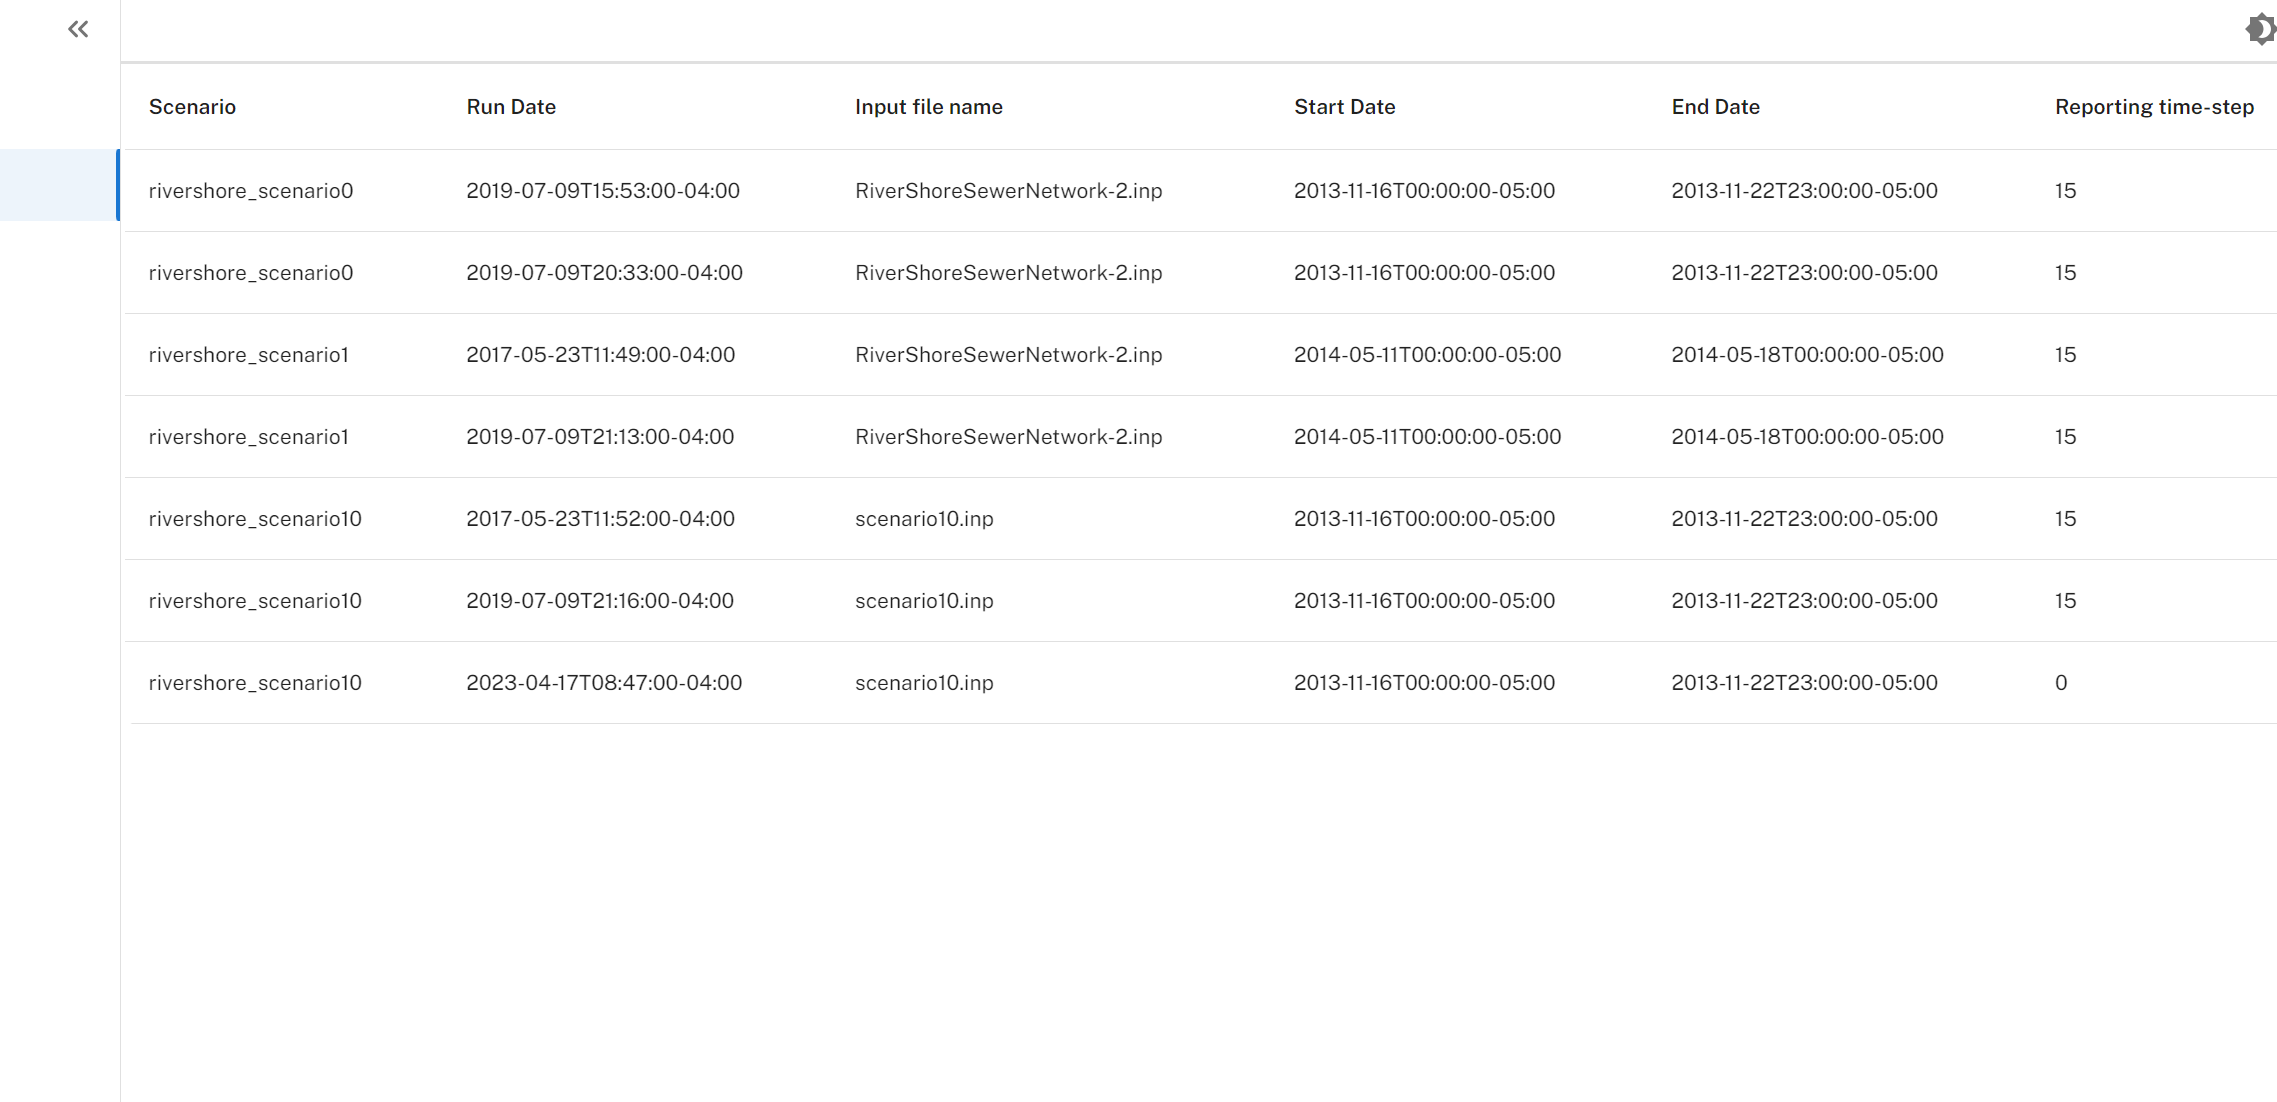
- The table do we need all the columns. (Like Run date?)
- Can we shiny the table it looks really um... plain
- Filtering and Order are both features we want.
- Scenario Details.
- Time?
- Create a icon for HydroTrek. We have a Logo but we need an Icon that we can put everywhere.
- What is the format that we need for an icon.
- How do we create an icon.
- Write it up so that GQCIndia can do it.
- Dashboard Page
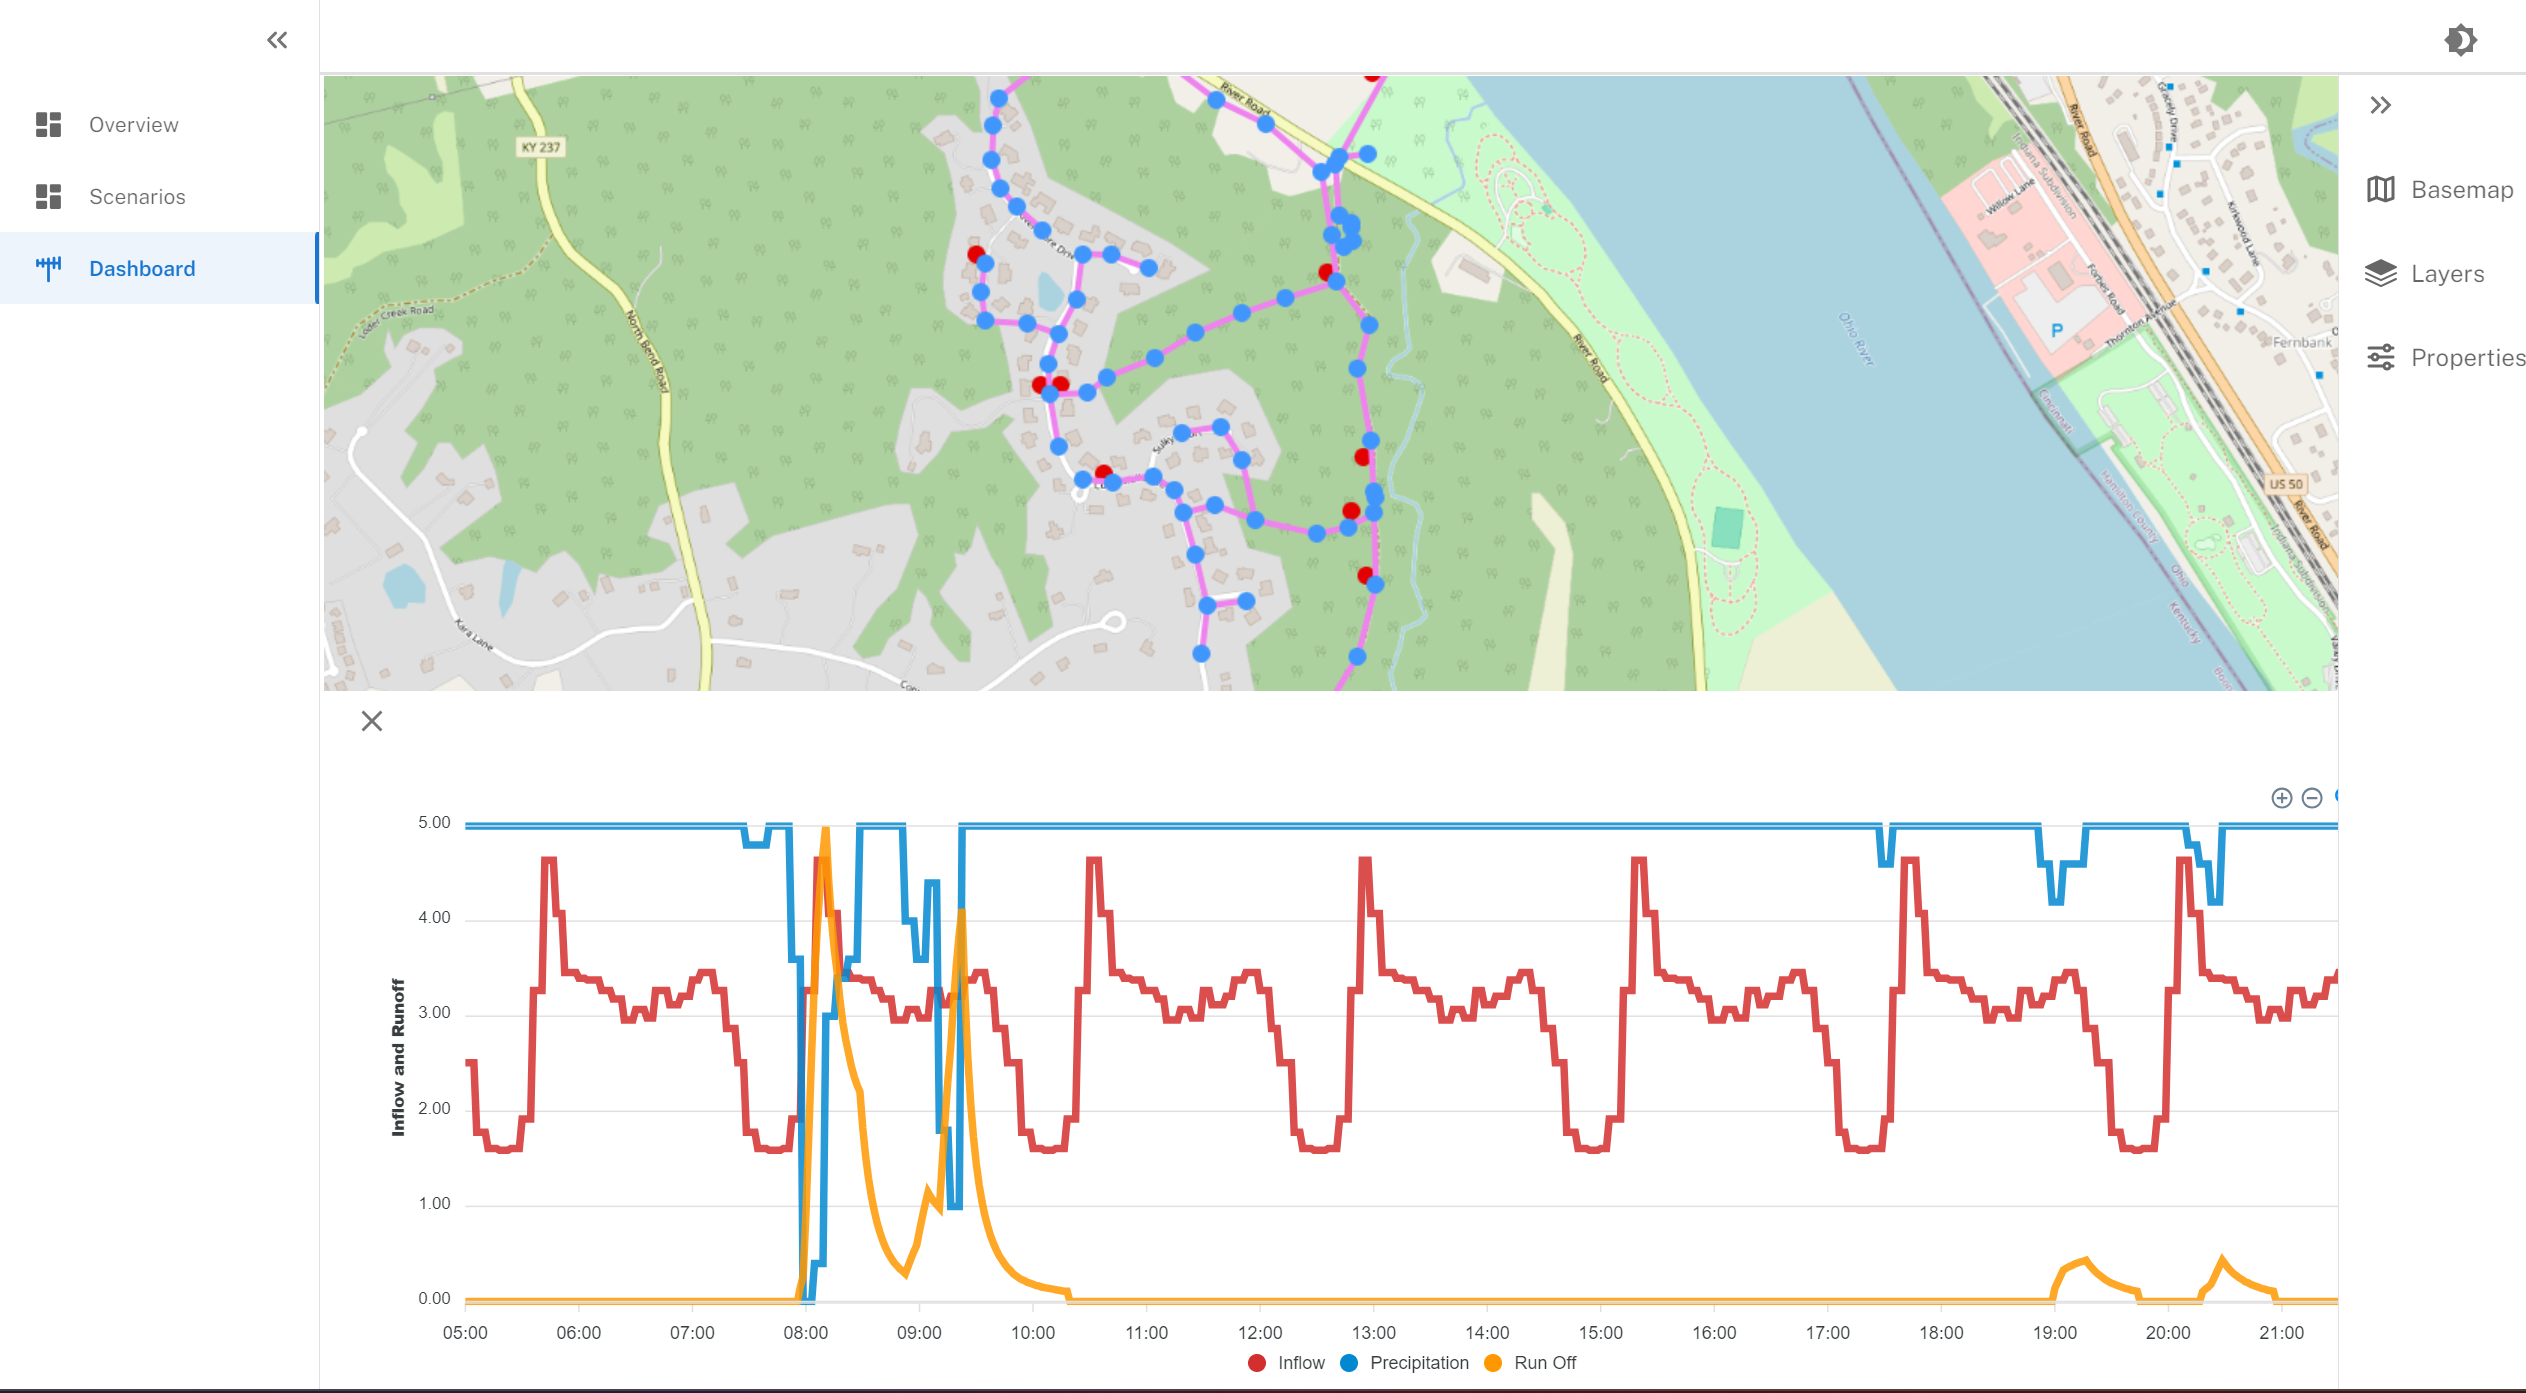
- Rename. It is a map page with Results...
- The Layers do not work on this task bar. So take it out.
- Do we want to Rework the map to ESRI?
- The System map is not intuitive you have to go over and click on properties icon.
- At least rename to System Chart!
- From Jira
- Update UI to use Drawers instead of white panel at the bottom.
- How can we create a Schematic in Rivershore.
- Get rivershore running in localhost.
- Look into the Schematic code.It is called Calculated Flows.
- Look for functional Specs.
Other
- RSMS Look up how NFQ is generated.
- How is it done on Ohio River.
- How is it doen on Des Moines.
List of things for Shiny Options for DWD:
- Heat Map for pressure on DWD
- Start with a static weighted heat map.
- Create a HMI Diagrams
- Flow Network Map - Arrows pointing in the direction of flow.
- Clickable images - may not be describing this right. Not a map but an image of things like outlet where we can click and see things.
- Alarms Setting and using them during a simulation.
- Dark mode with Dark maps is the default.
- Annotations next to Links and Nodes (flow and Demand).