Colab notebooks for Collimator
These are created on the google account
hydrotrekgqc@gmail.com
Sending the simulation result CSV to visualize with Grafana
Notebook link
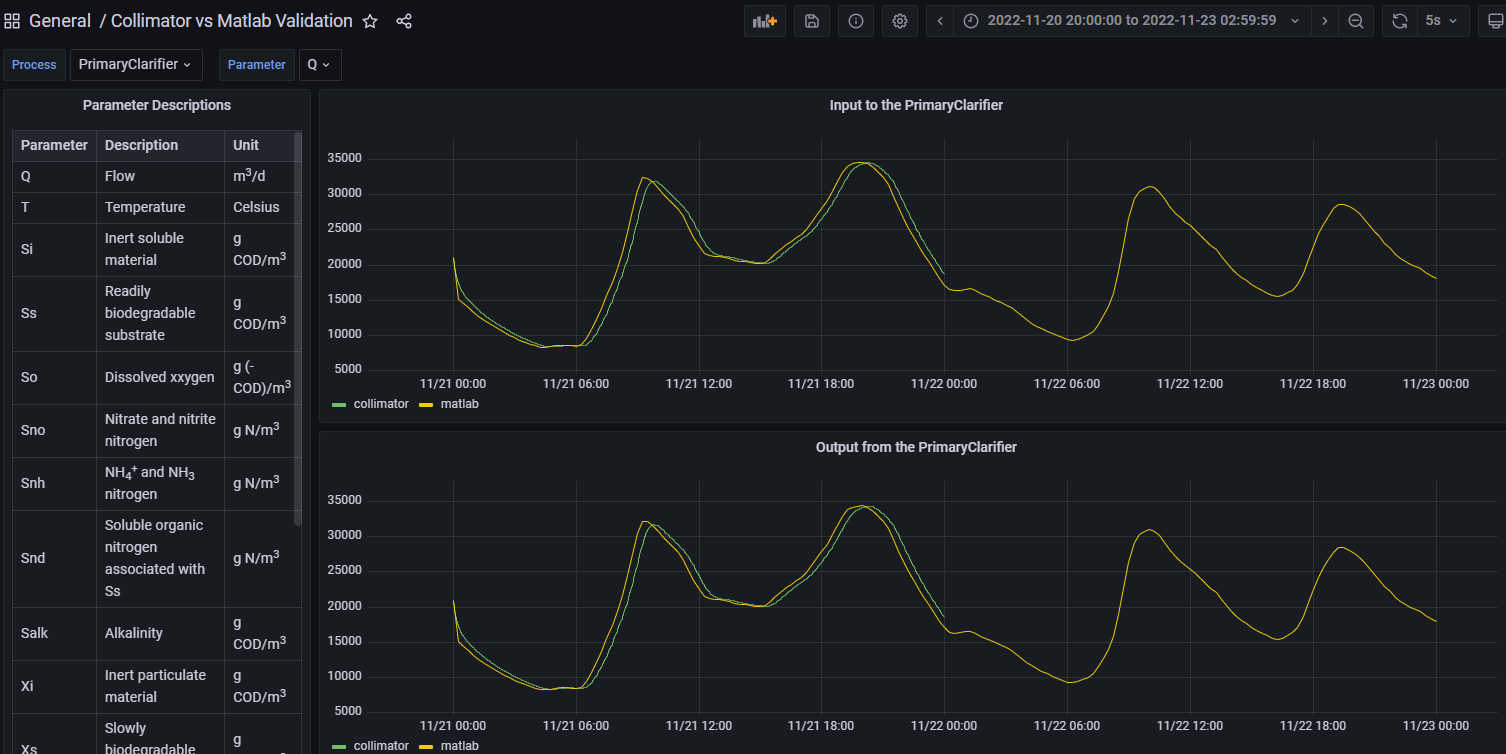
- This will read in the CSV files generated from MATLAB and Collimator Simulators and visualize the results in Grafana dashboard,
Collimator vs Matlab Validationwhich is available ingqccollimatororganization in grafana cloud. - CSV data is first sent to TDEngine cloud (@
pavan@gqc.com) and grafana is quering data from that.
Adding new submodules to the visualizer
In the
info csvfiles, specify 'in0', 'out0' under 'Port' column for the new submodels.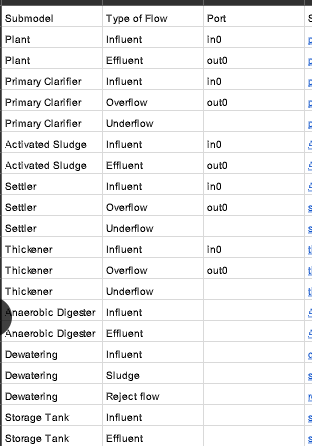
In the colab notebook append the new submodule names to this dictionary. The (key, value) pair should be arranged as 'Name for Grafana':'Name in CSV'. The only difference I had to make so far is just removing the space. Check the already available submodule names as examples.
# Append submodel names here
submodel_names = {'Plant': 'Plant', 'PrimaryClarifier' : 'Primary Clarifier', 'ActivatedSludge':'Activated Sludge', 'Settler':'Settler', 'Thickener':'Thickener'}
Update the grafana dashboard variable with the new submodules.
- Goto dashboard settings.
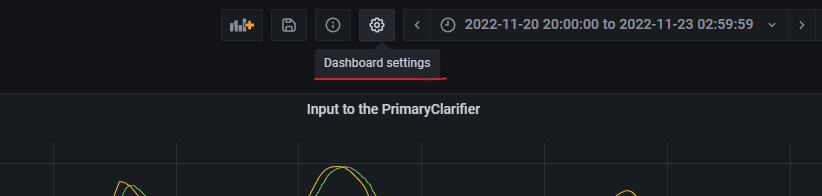
- Goto
Variablesand selectProcess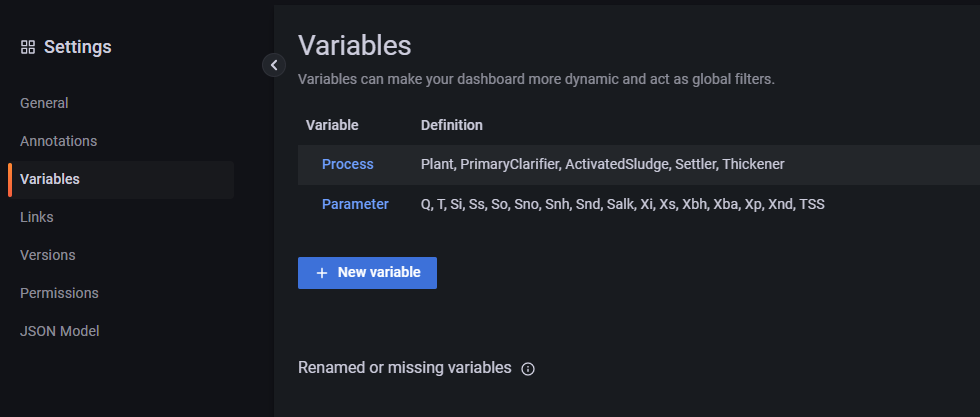
- Append the new submodules to the
Custom Optionsfield.
- Goto dashboard settings.