FFT experiments
Obtaining the correct signal amplitudes on the FFT
Currently we are using
liquid-dspC library for FFT calculation inUbunutapplications (DeepVibe ServerandDSP app) The amplitudes found in the FFT side are off from the amplitudes in the time-domain Sin waves although the peaks are reported at the correct frequencies.
Here is the summary table of the experiments:

It seems this discrepancy boils down to a principal behind DFT, the signal should be periodic. The signal segment sent for FFT should not have partial cycles. If there are partial cycles, the FFT result will contain noise. More details are described in the point 4 below.
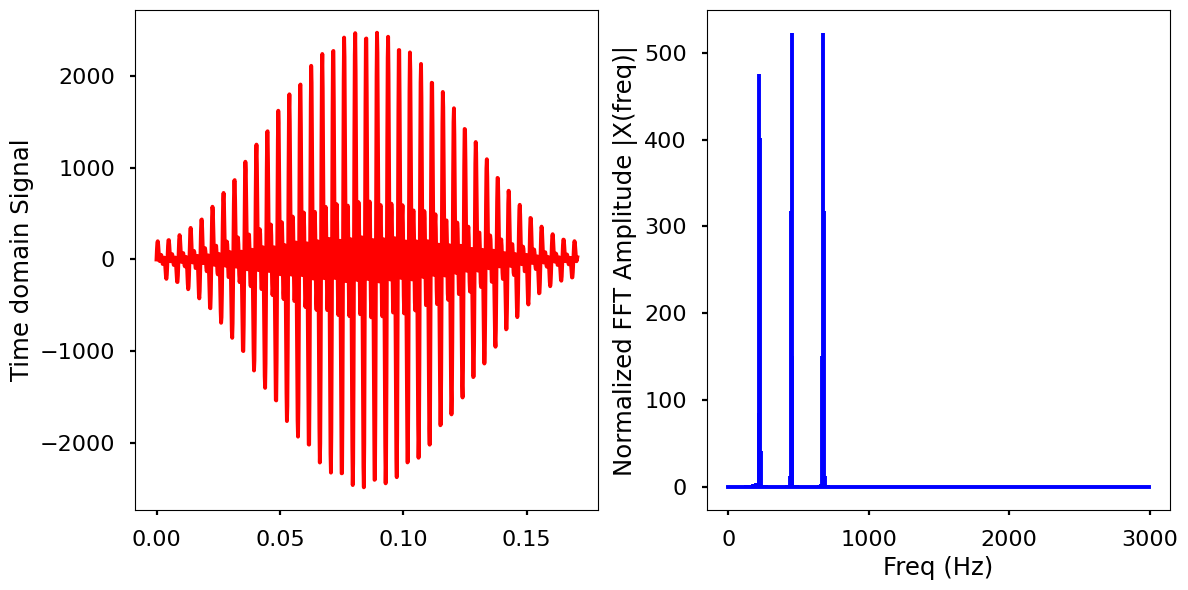
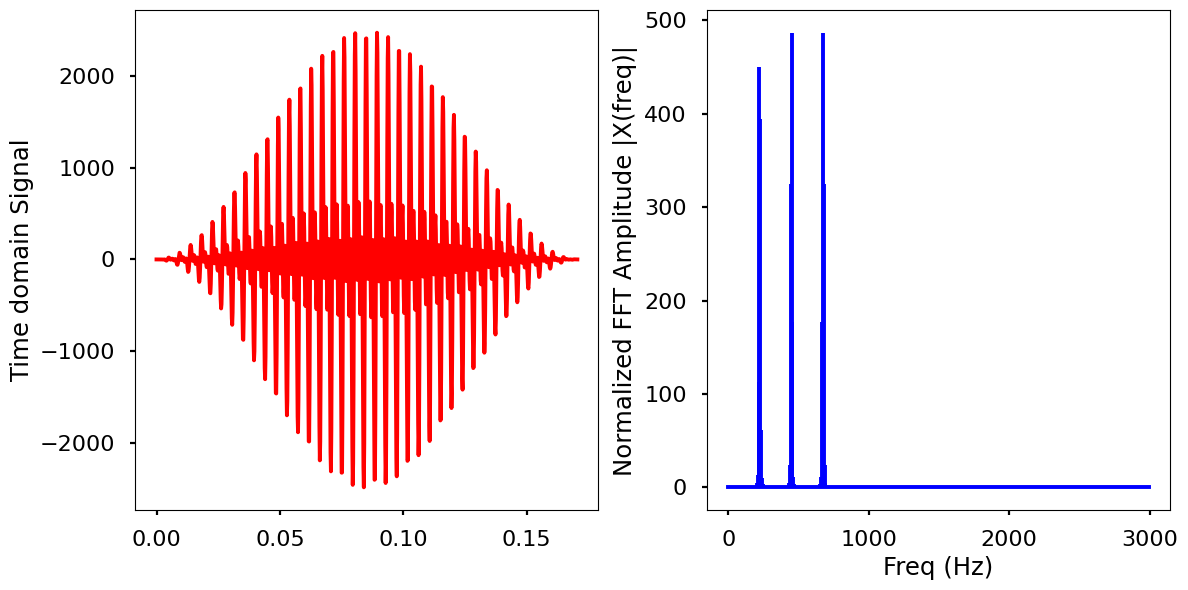
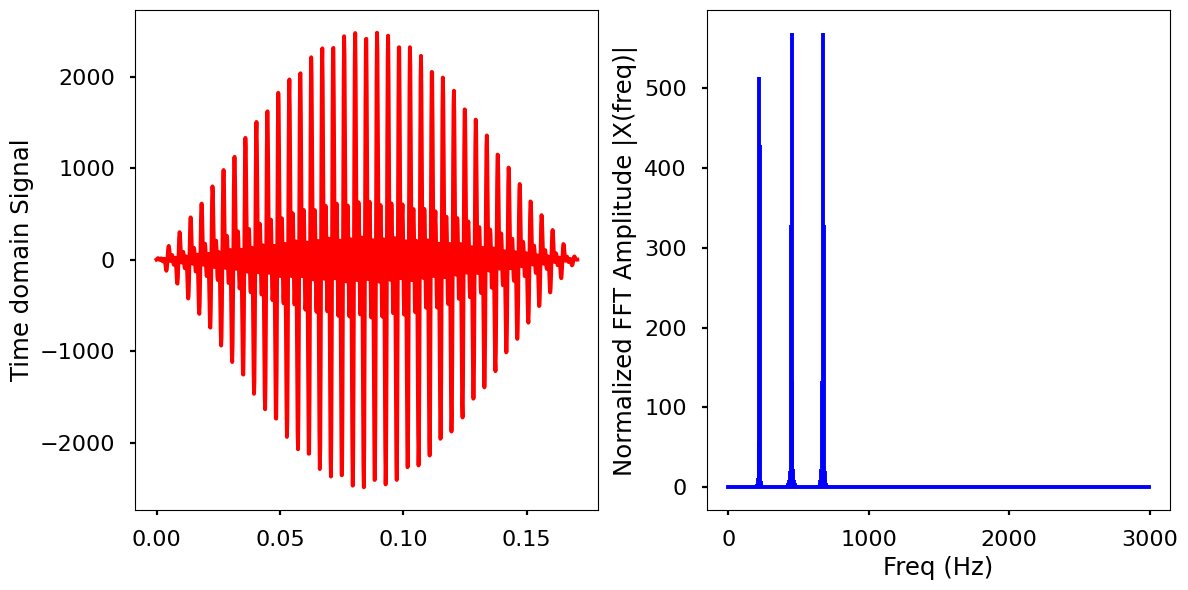
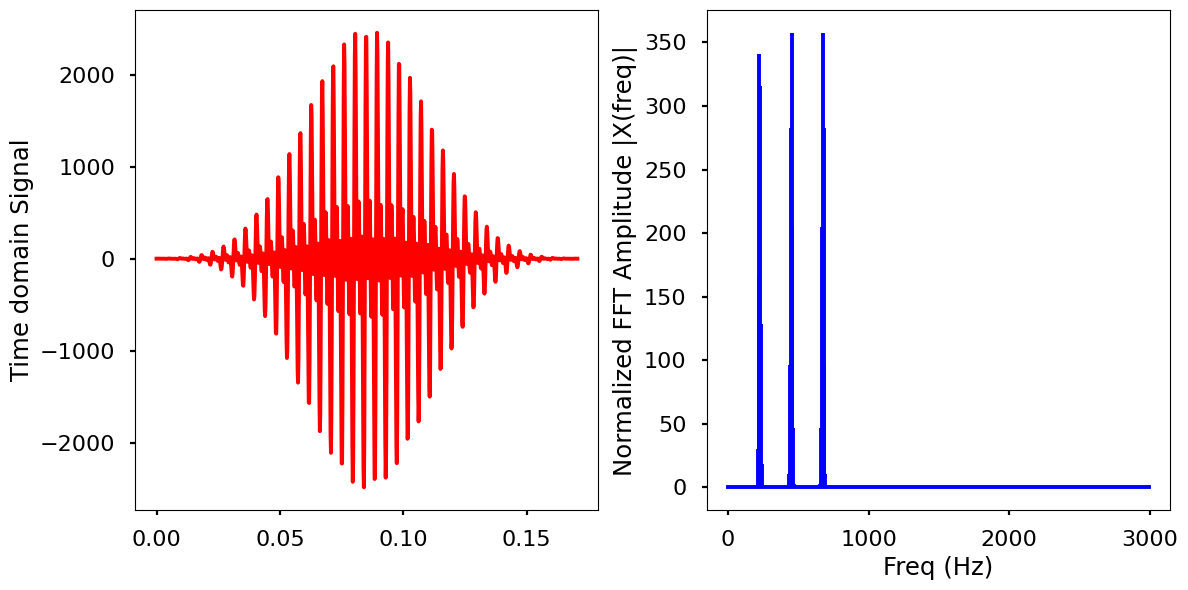
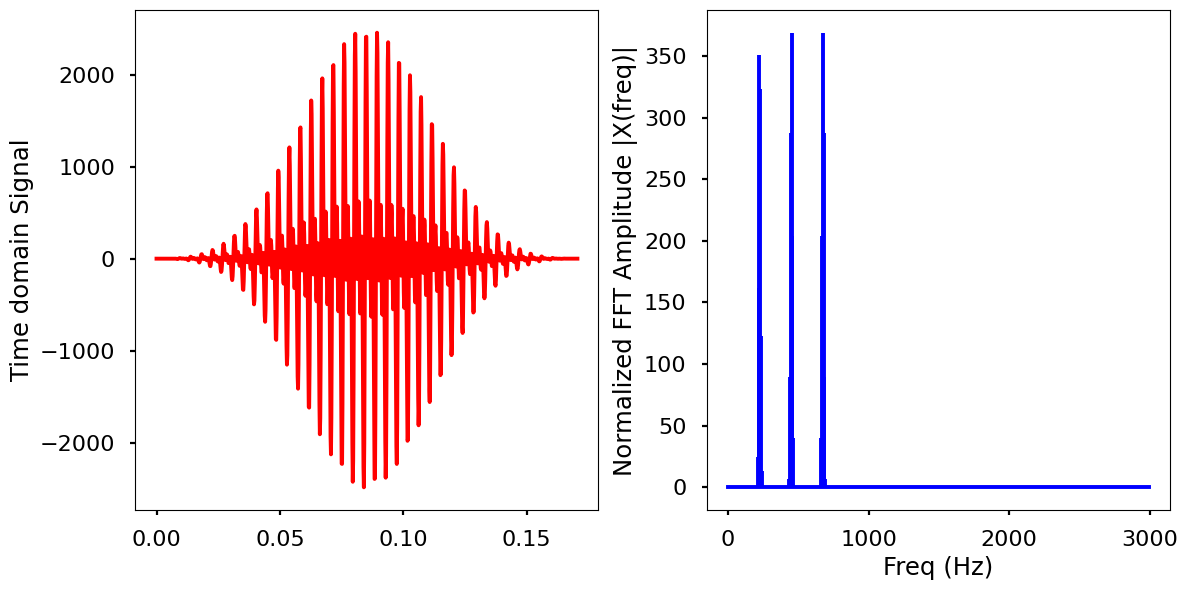
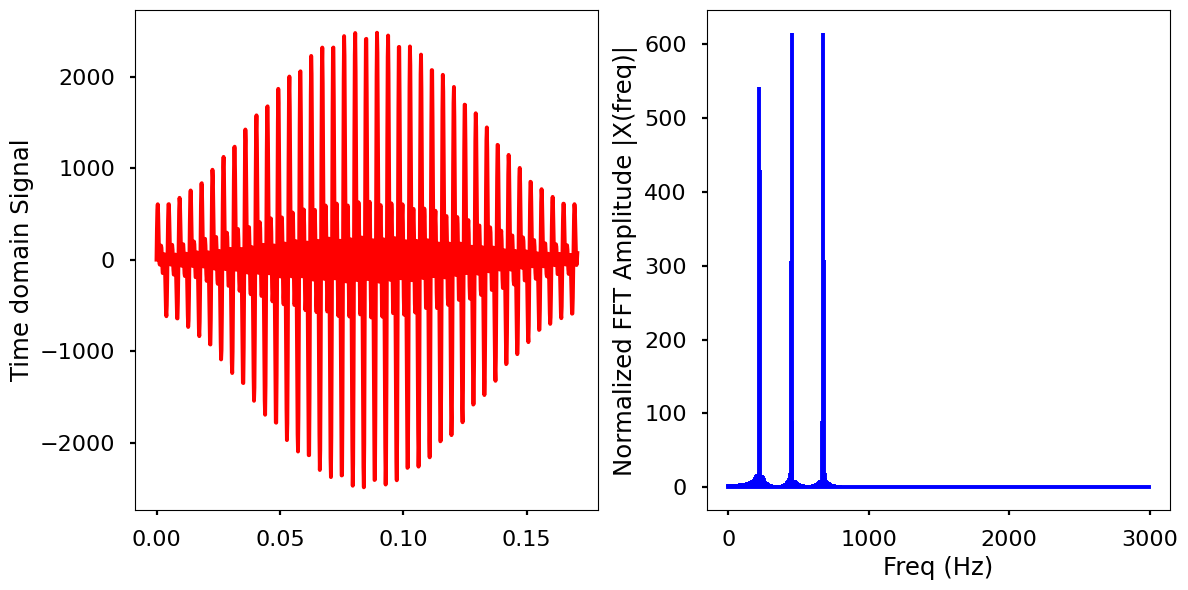
Windowing is tested in point 5 below. It seems windows like hamming and hanning is able to emphasize the major frequency components comparing to non-windowed version of the same signal. However, windowing attenuates the signal resulting in lower amplitudes in the peaks in the frequency domain.
We identified that acceleration data storage was using a lower resolution for acceleration data. Resolution was increased by 16x to fully utilize the storage and the FFT output amplitudes were recorded.


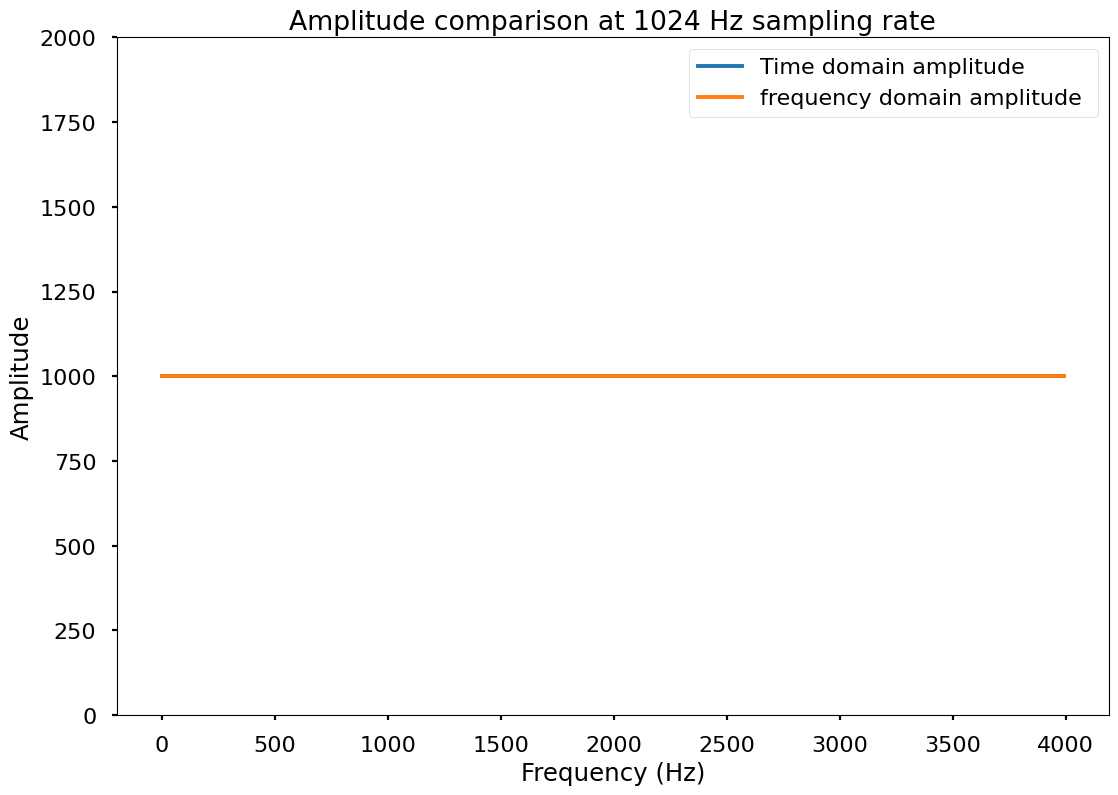
Only one line is visible in each plot because they are overlapping.
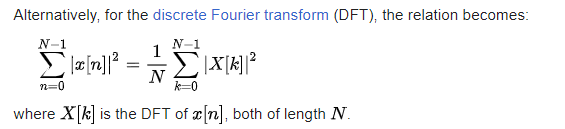
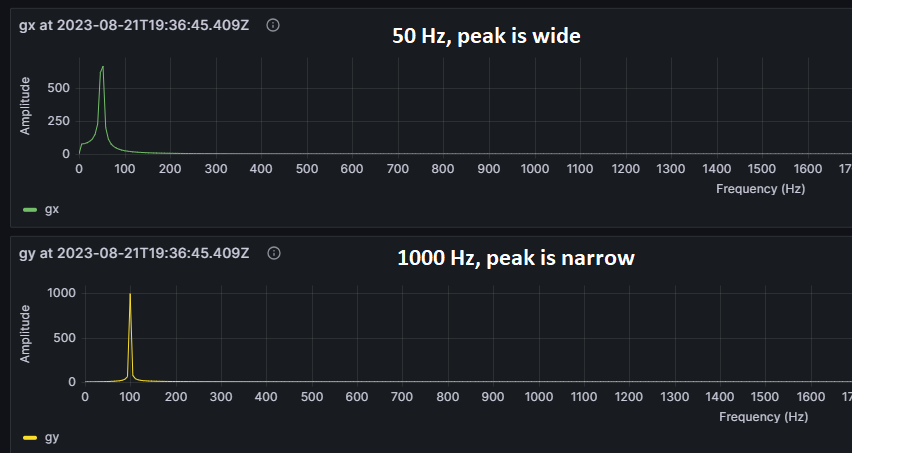
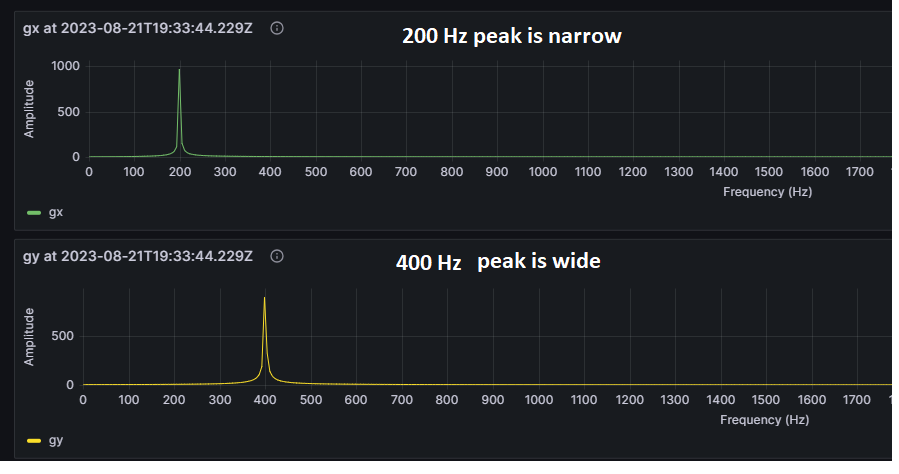
Another observation here is that where the amplitude of FFT signal is less, the peak seems to be wider. This might have to do with the relationship given by Parseval's theorem. My take is on that is as the area under the fft graph has a correlation with the area under the time-domain signal, wider the fft peak, lower the peak amplitude will be.
I suspect FFT calculation method can be having an issue as it fails on certain frequencies. Our amplitude scaling works as expected. Ideally, we should be getting identical peaks shifting across the frequency axis as we change the sin wave frequency.
Following are FFT results of pure sin waves with the peak amplitude of 1000.
This should be 100Hz and not 1000 Hz
I did an experiment using Python to generate pure sin waves, calculate FFT and obtain the peak FFT amplitudes just as what we did using
liquid-dsp.Output for a single sinwave:
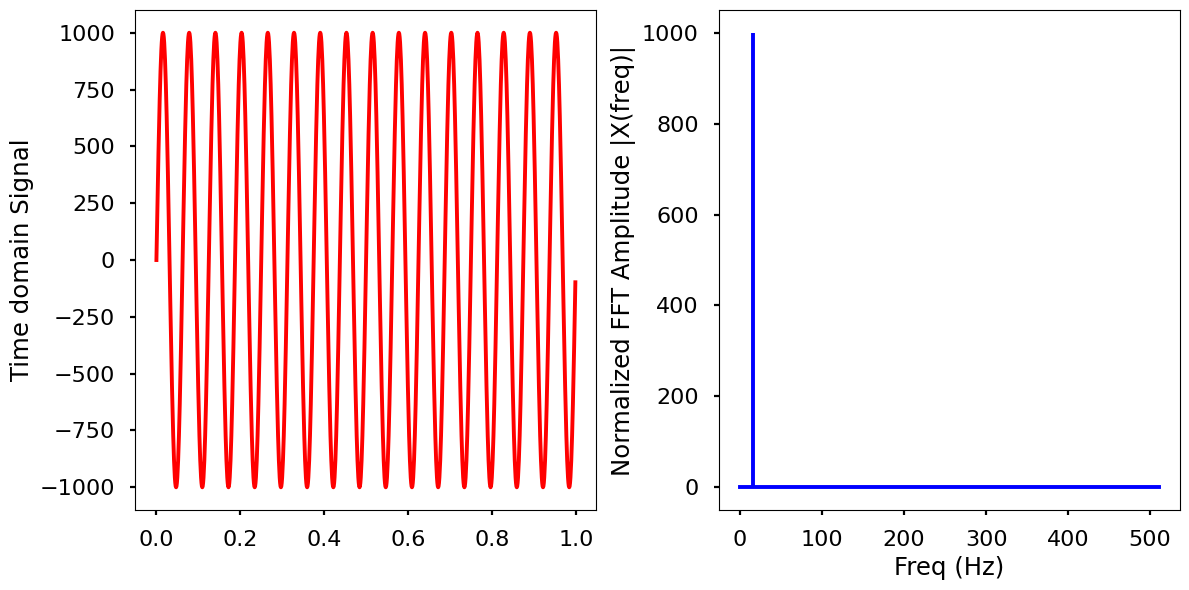
which gives results as expected.
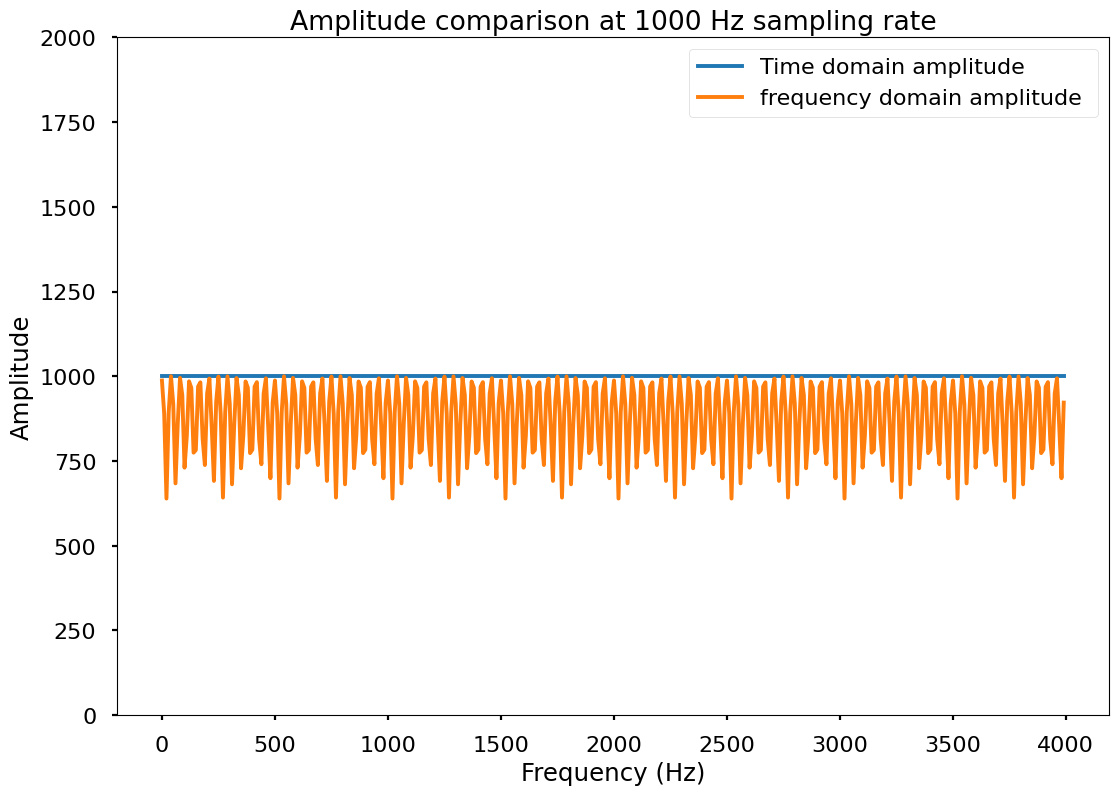
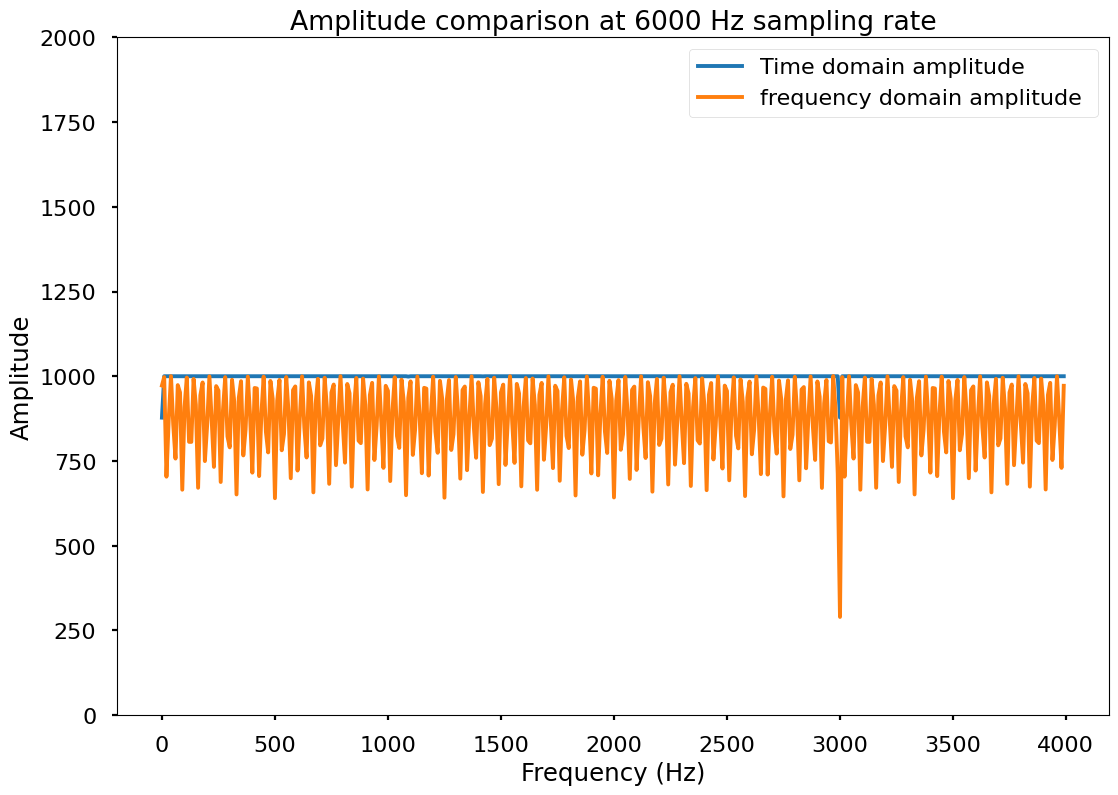
Saw some strange results when amplitudes were compared at different sampling rates.
Amplitude comparison for signals with 1024 samples at 1kHz:
Amplitude comparison for signals with 1024 samples at 1.024kHz:
Amplitude comparison for signals with 1024 samples at 6kHz:
Based on the results of Python based FFT I tested the same sampling rate 1.024kHz in C. It gives exact correct amplitude of 1000 for each of the Sin wave frequencies we've tested earlier. I'll check further into the relationship between the sampling rate, number of samples vs. FFT result.
E.g. this is the result for 50Hz and 100Hz signals which showed significant difference in FFT amplitudes at 6kHz
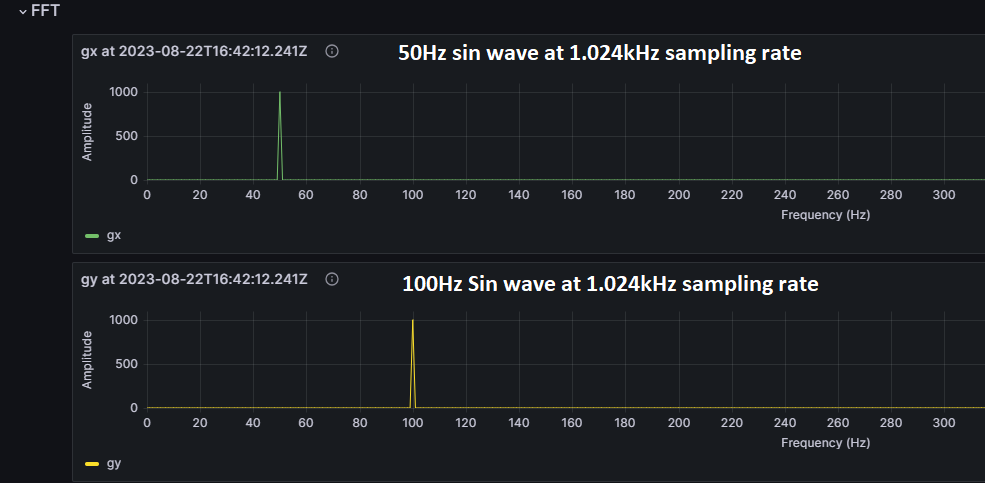
DFT works on finite and periodic signals and assumes the captured signal ends aligning with a signal period.
When you use the FFT to measure the frequency component of a signal, you are basing the analysis on a finite set of data. The actual FFT transform assumes that it is a finite data set, a continuous spectrum that is one period of a periodic signal. For the FFT, both the time domain and the frequency domain are circular topologies, so the two endpoints of the time waveform are interpreted as though they were connected together. When the measured signal is periodic and an integer number of periods fill the acquisition time interval, the FFT turns out fine as it matches this assumption. [source]
Seems the issue we were having with FFT boils down to this.
- If the captured signal does not end with a partial signal period, the FFT result is accurate.
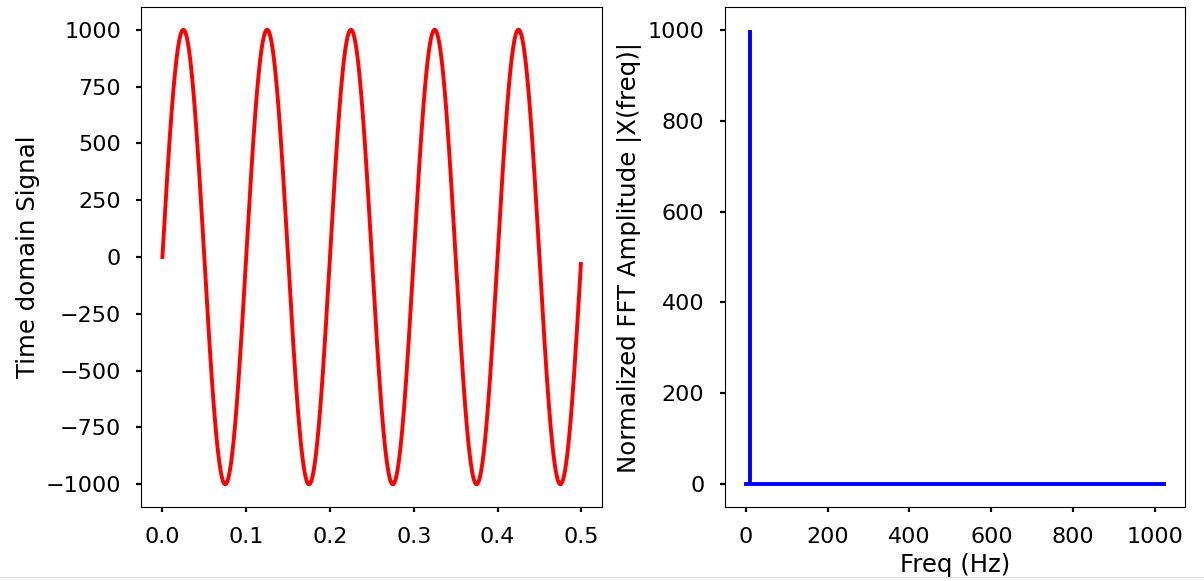
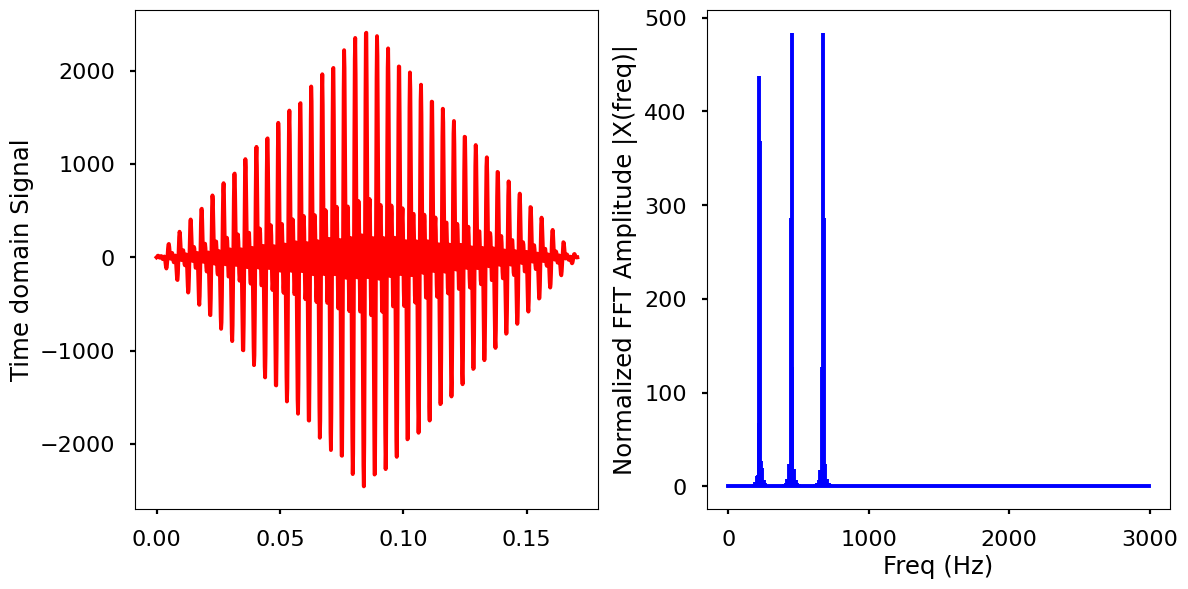
- If the captured signal contain partial period at the end (i.e. does not complete full cycle) fft results contain noise.
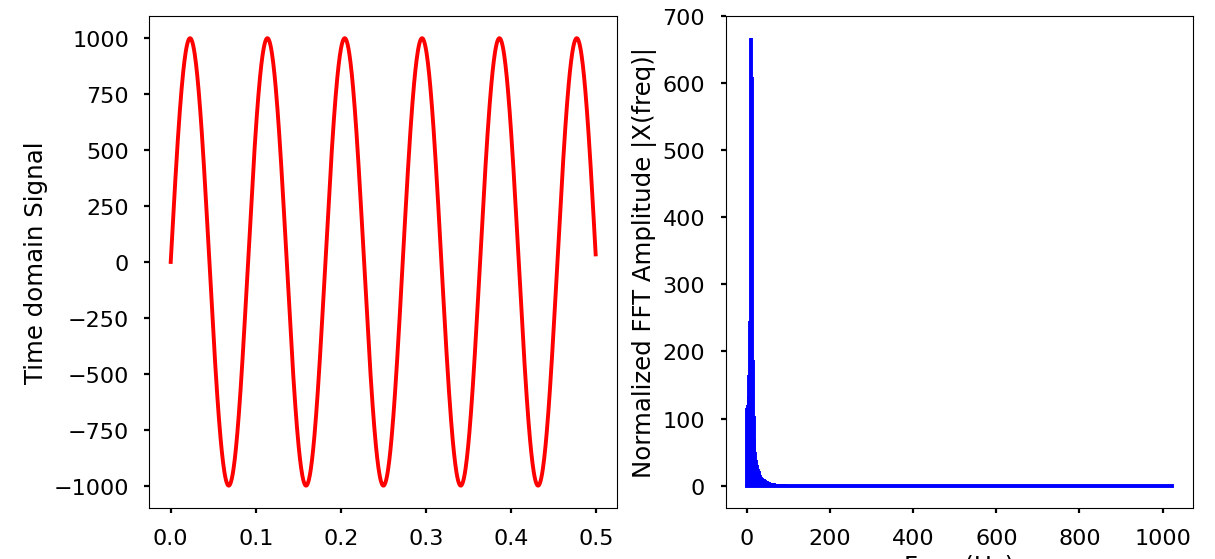
- If the captured signal does not end with a partial signal period, the FFT result is accurate.
To mitigate this issue, windowing on the time domain signal prior to calculating FFT is said to be helpful.
Here is a test done with a source signal of 225Hz with an amplitude of 1000 combined with 2nd and 3rd harmonics with the same amplitude.
- With no windowing
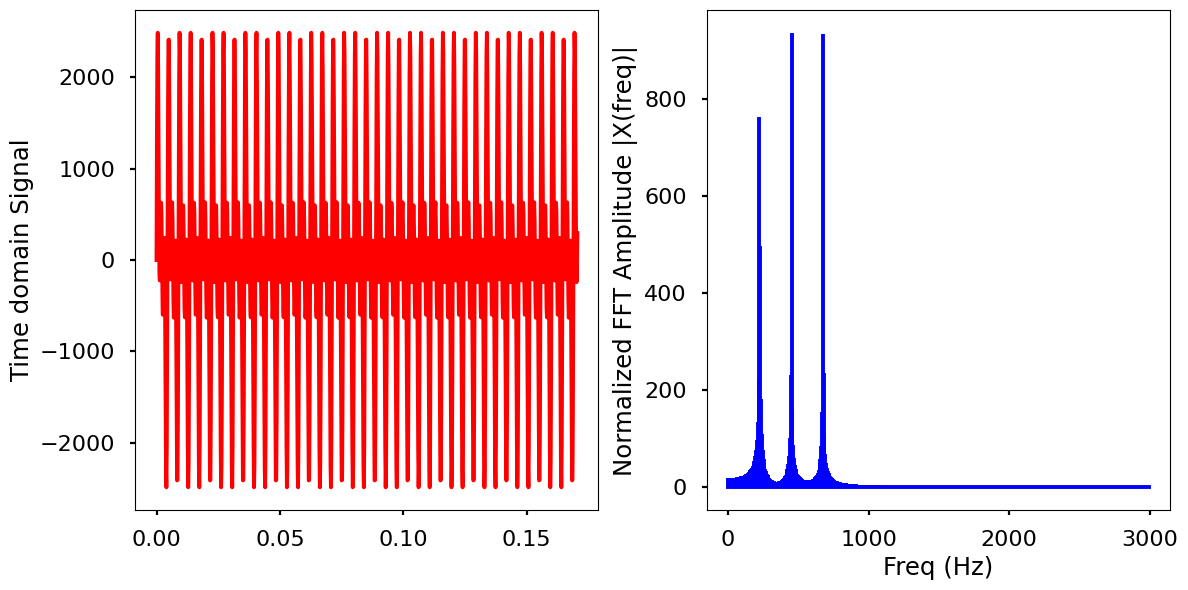
- Window: barthann
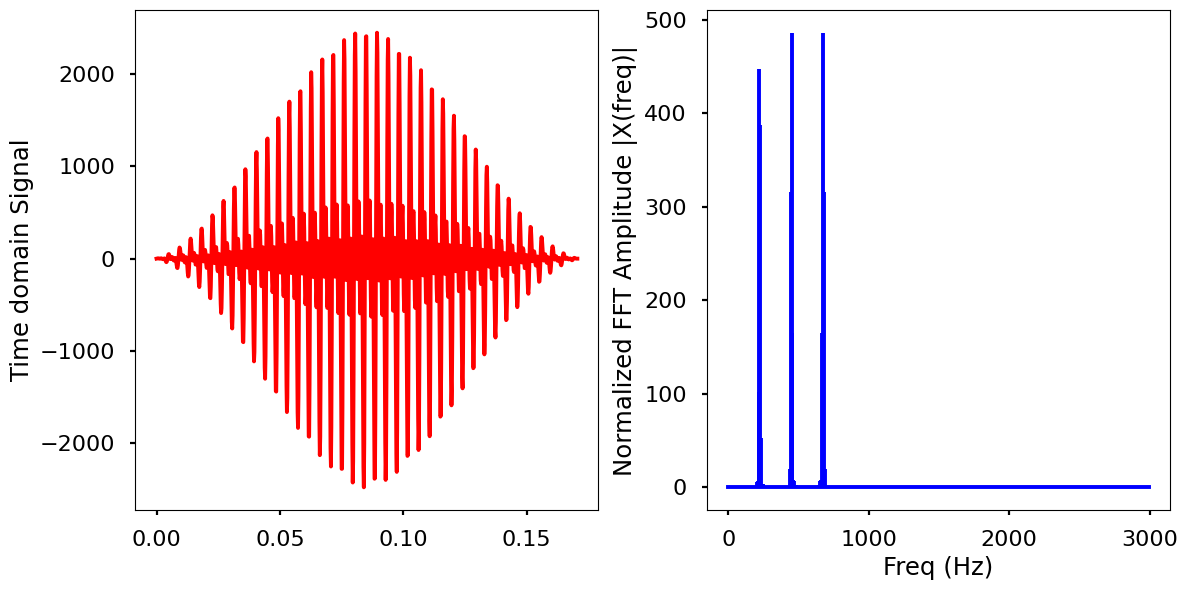
- Window: bartlett
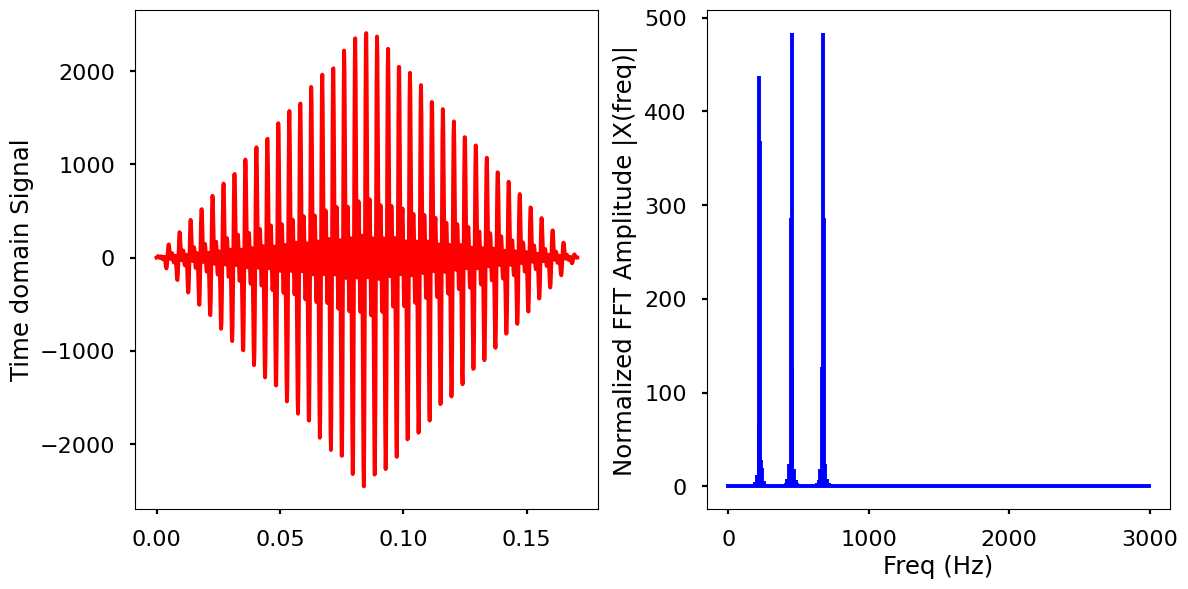
- Window: blackman
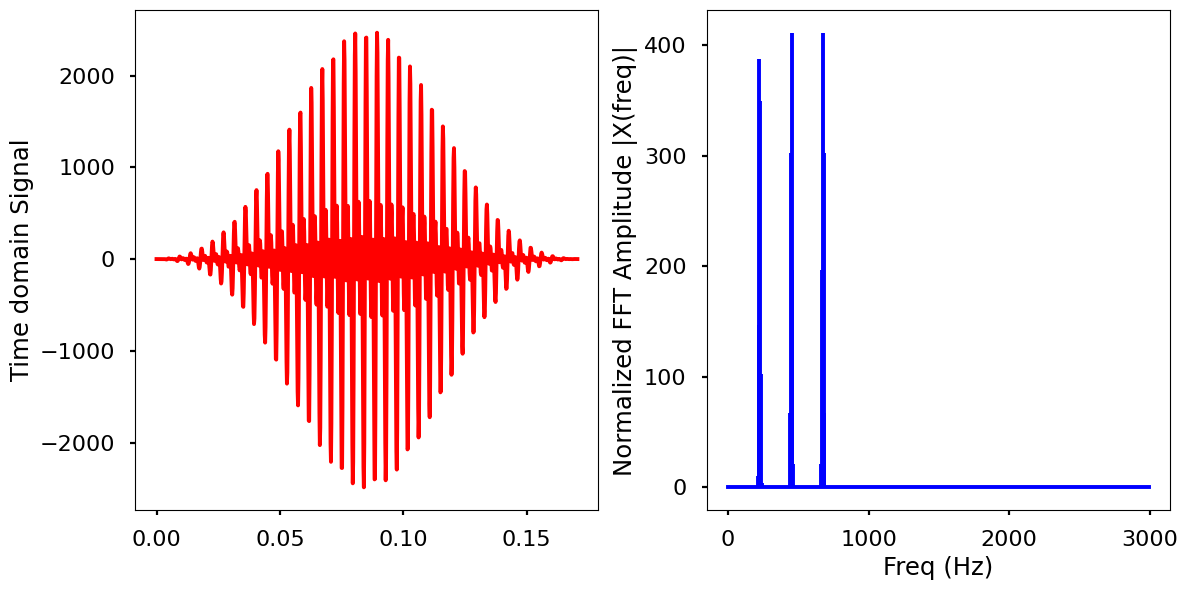
- Window: blackmanharris
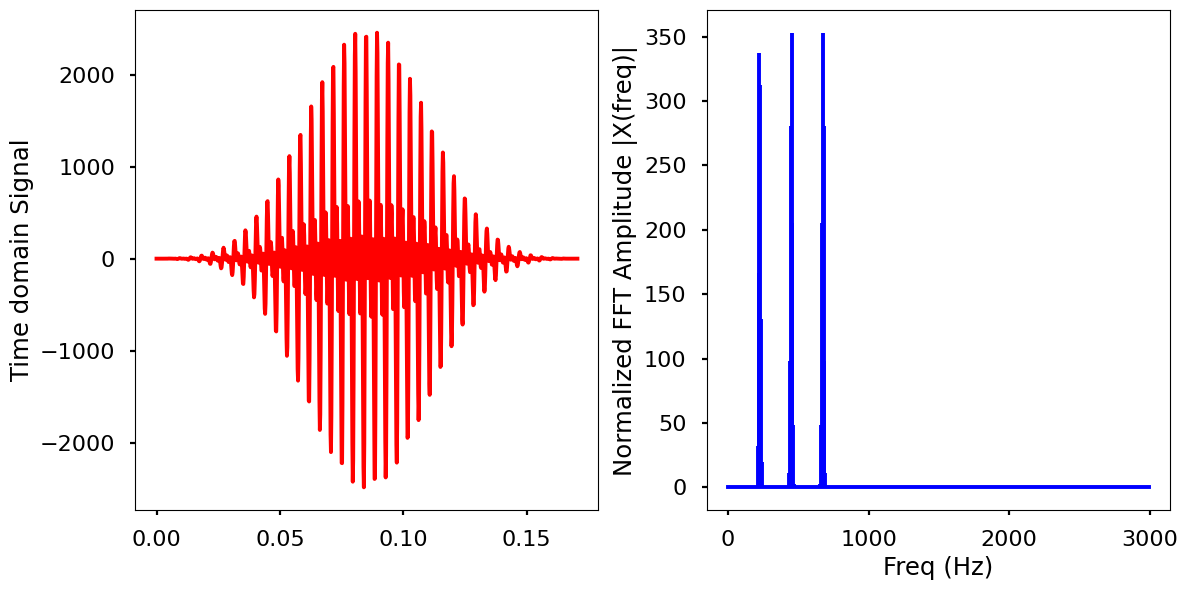
- Window: bohman
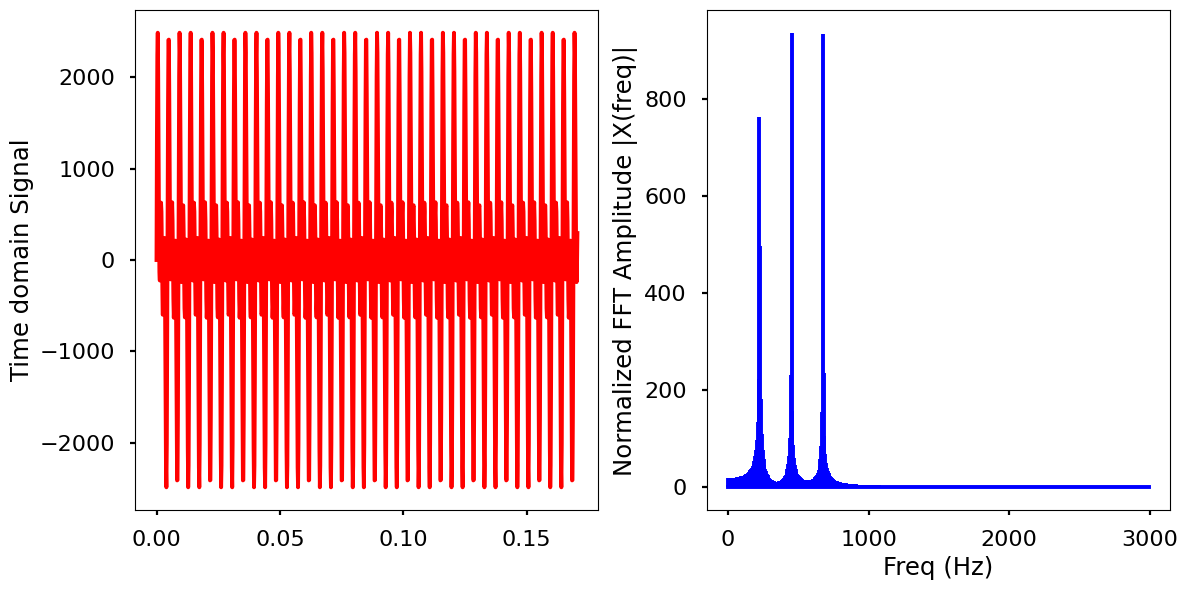
- Window: boxcar
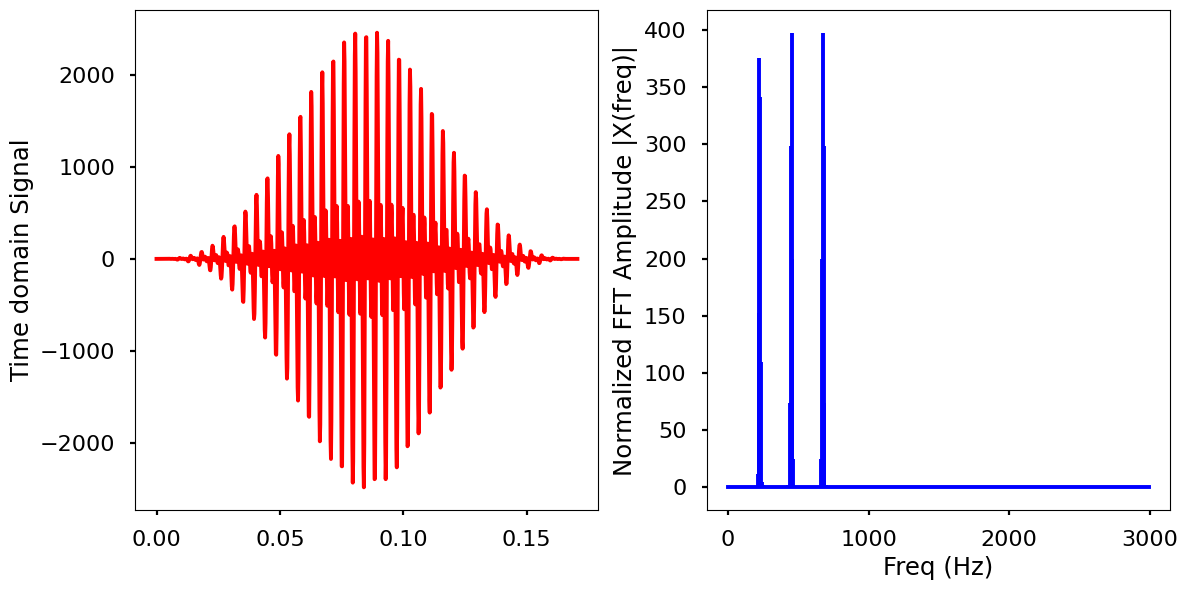
- Window: cosine
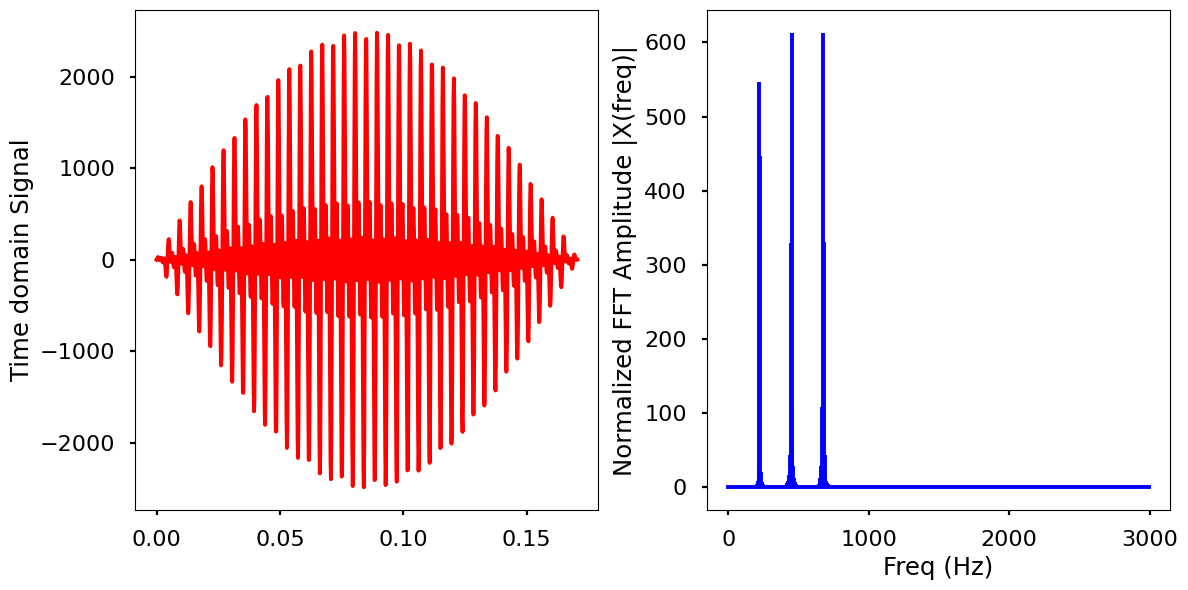
- Window: flattop
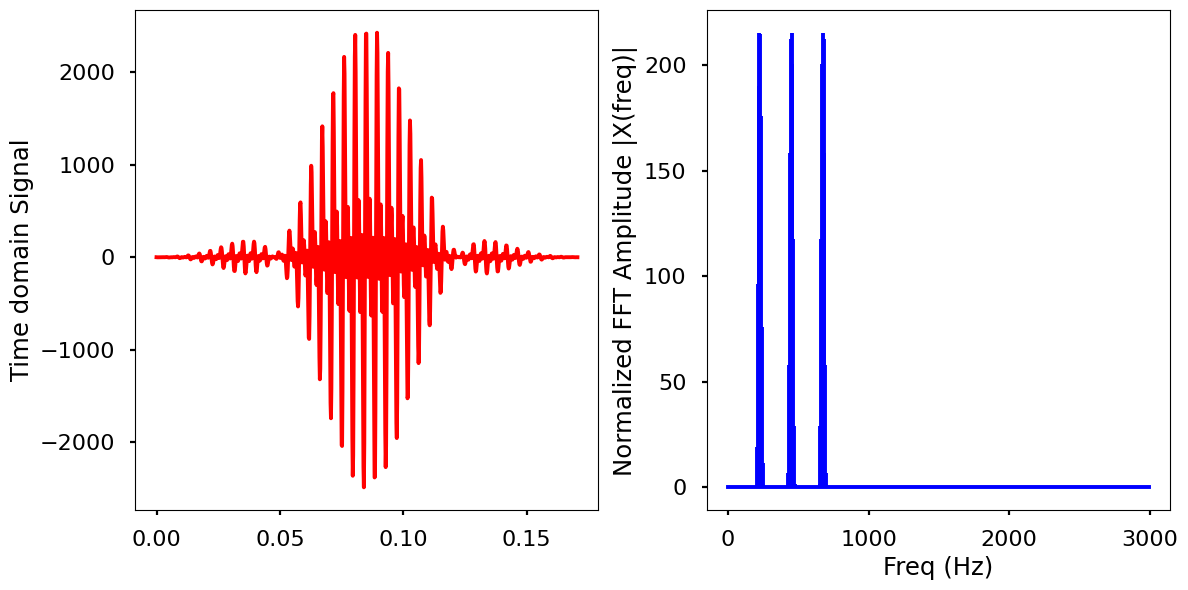
- Window: hamming
- Window: hann
- Window: lanczos
- Window: nuttall
- Window: parzen
- Window: taylor
- Window: triang
- With no windowing
With
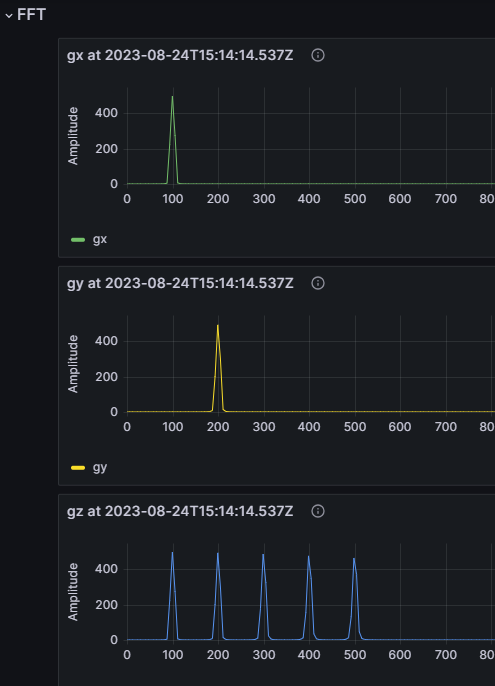
hannwindow andamplitude correctionfactor of 2.0, we get the following FFT result for gx) 100Hz sinwave with amplitude of 500, gy) first harmonic of the gx signal, gz) gx with 4 more harmonics