Grafana Data Visualization
Installing Grafana in Ubuntu
The installation instructions changed per Sudhir's email on 4/26/2024.
gqc@gqc-Aspire-5749:~/Downloads$ sudo dpkg -i grafana-enterprise_10.4.2_amd64.deb
Selecting previously unselected package grafana-enterprise.
(Reading database ... 196296 files and directories currently installed.)
Preparing to unpack grafana-enterprise_10.4.2_amd64.deb ...
Unpacking grafana-enterprise (10.4.2) ...
Setting up grafana-enterprise (10.4.2) ...
Adding system user `grafana' (UID 130) ...
Adding new user `grafana' (UID 130) with group `grafana' ...
Not creating home directory `/usr/share/grafana'.
### NOT starting on installation, please execute the following statements to configure grafana to start automatically using systemd
 sudo /bin/systemctl daemon-reload
 sudo /bin/systemctl enable grafana-server
### You can start grafana-server by executing
 sudo /bin/systemctl start grafana-server
Use Grafana with TDEngine
Start taosAdapter which is required for TDEngine connection.
sudo systemctl start taosadaptersudo systemctl enable taosadapter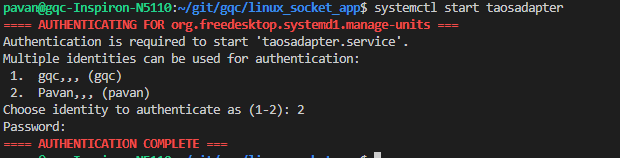
Install tdengine plugin for grafana.
Option 1: Install Using terminal
TDENGINE_DS_NAME=TDengine
TDENGINE_CLOUD_URL=http://localhost:6041
TDENGINE_USER=root
TDENGINE_PASSWORD=taosdata
bash -c "$(curl -fsSL https://raw.githubusercontent.com/taosdata/grafanaplugin/master/install.sh)"
Option 2: Install using GUI. For more details see here.
- Open
http://localhost:3000. - From the left toolbar, goto
Configuration>Plugins. - Search for
TDEngine. - Make a connection with default TDEngine values (or the values you set)
Eg:
- URL: http://localhost:6041
- username: root
- password: taosdata
- Open
Import the dashboard
See here for the steps on exporting a grafana dashboard.
Open grafana (Eg:
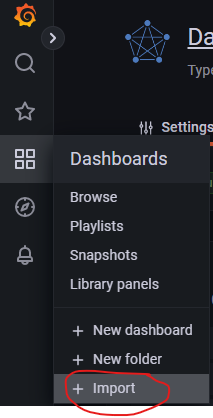
http://192.168.0.28:3000/replace the ip with address of grafana server) and goto dashboard > import.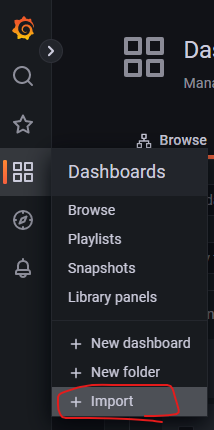
Import the json content by either uploading the file or pasting the json content. (Find the timeseries and FFT dashboard here)
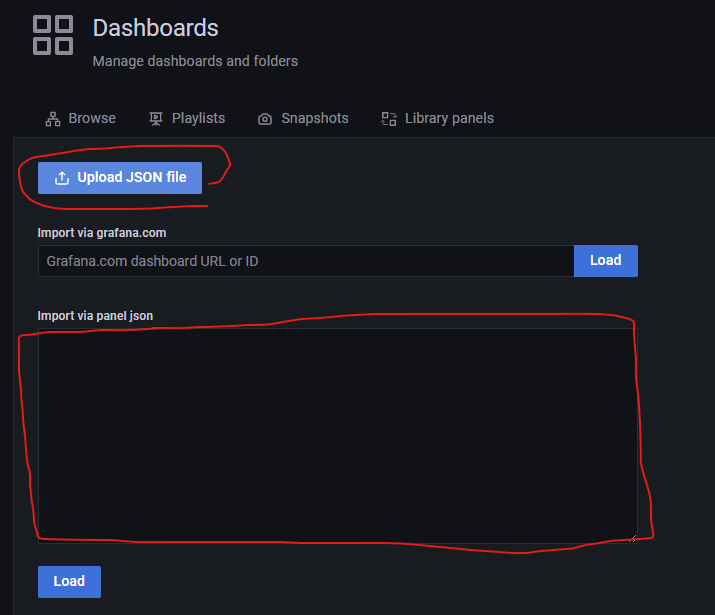
After uploading the file or pasting the json,
Optionswindow will come up. Select any environment variables from the next window. For example, following screenshot shows where to select theTDEnginedatasource in the new environment.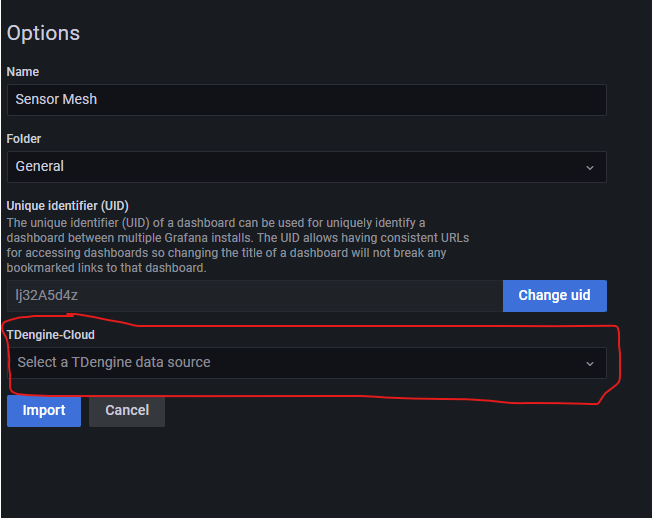
Add the dashboard and view it.
Sample snapshots
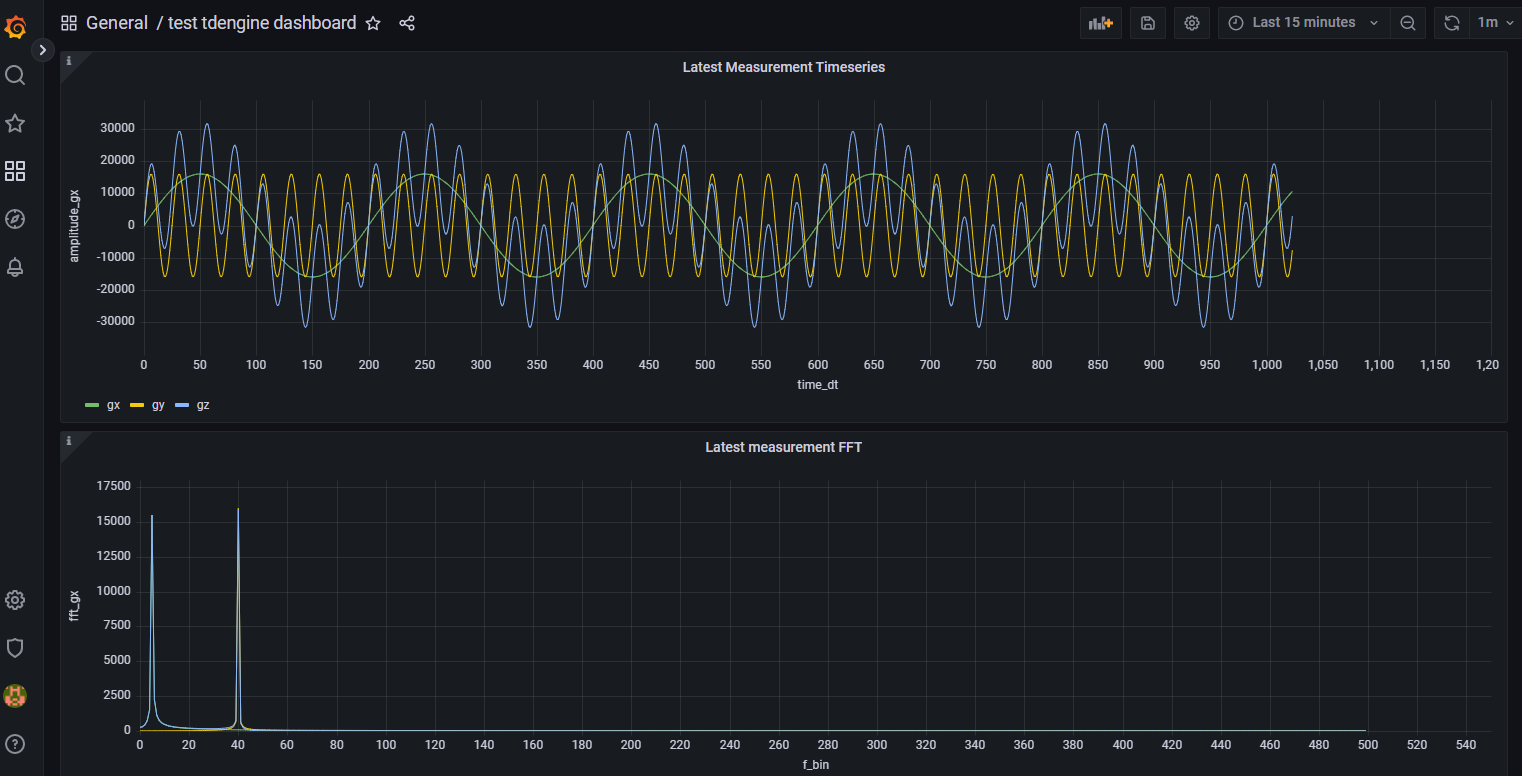
Dummy data visualization
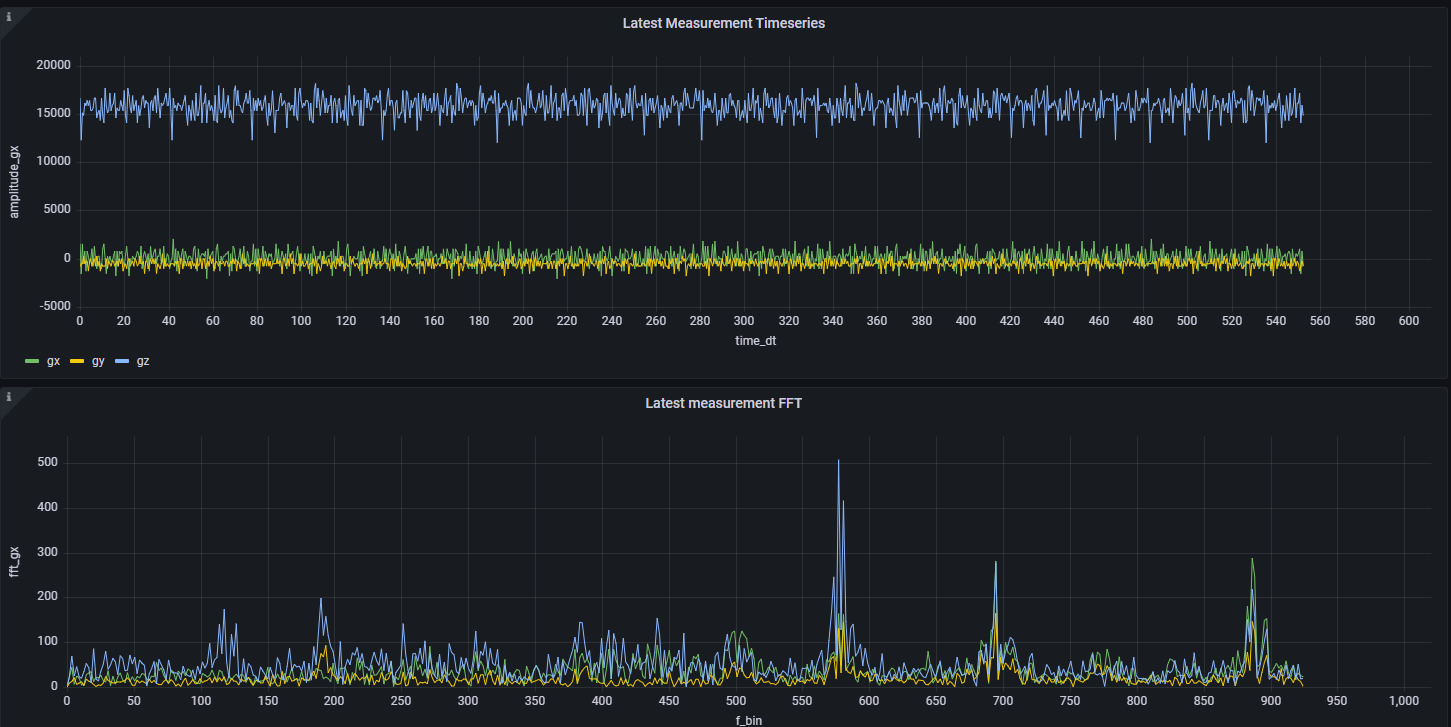
Actual sensor data
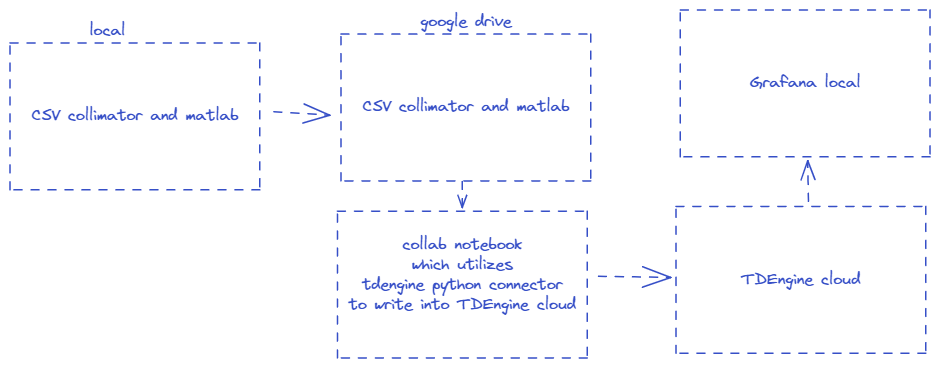
Use Grafana to compare Collimator and Matlab outputs
In Grafana goto
Configuration>Data Sources.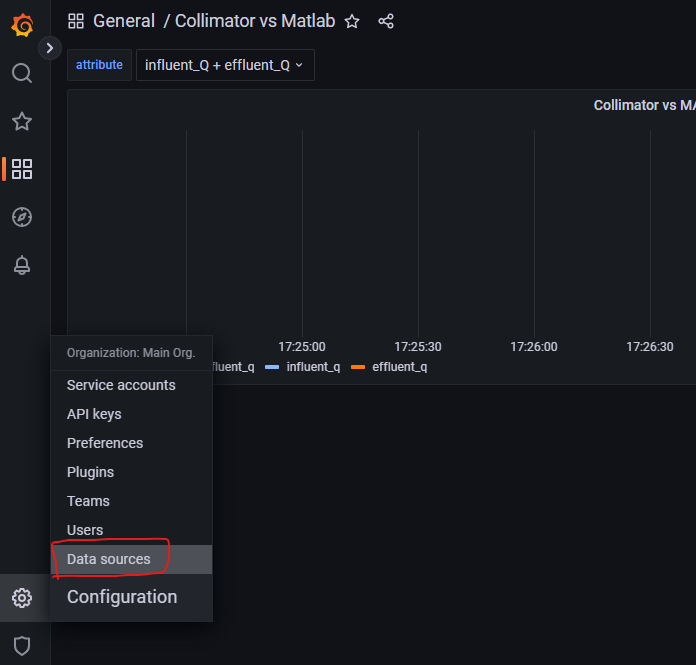
Click
Add datasource. And browse forTDEngine. Then use the following settings:- Name:
TDengine-Cloud - Host:
https://gw.us-east-1.aws.cloud.tdengine.com - Token:
eb75d3ce4fe27e9b4c37b56bce53c90cf604ef8e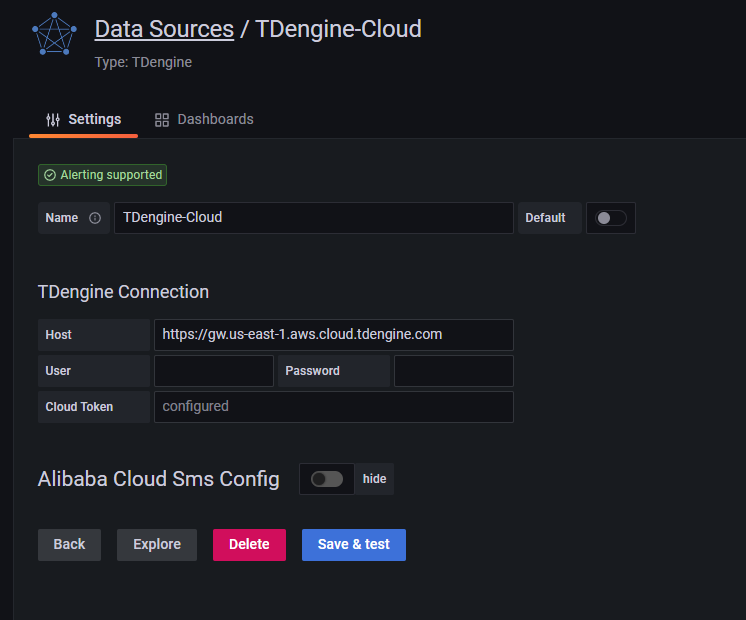
- Name:
Import the dashboard from this json to grafana.
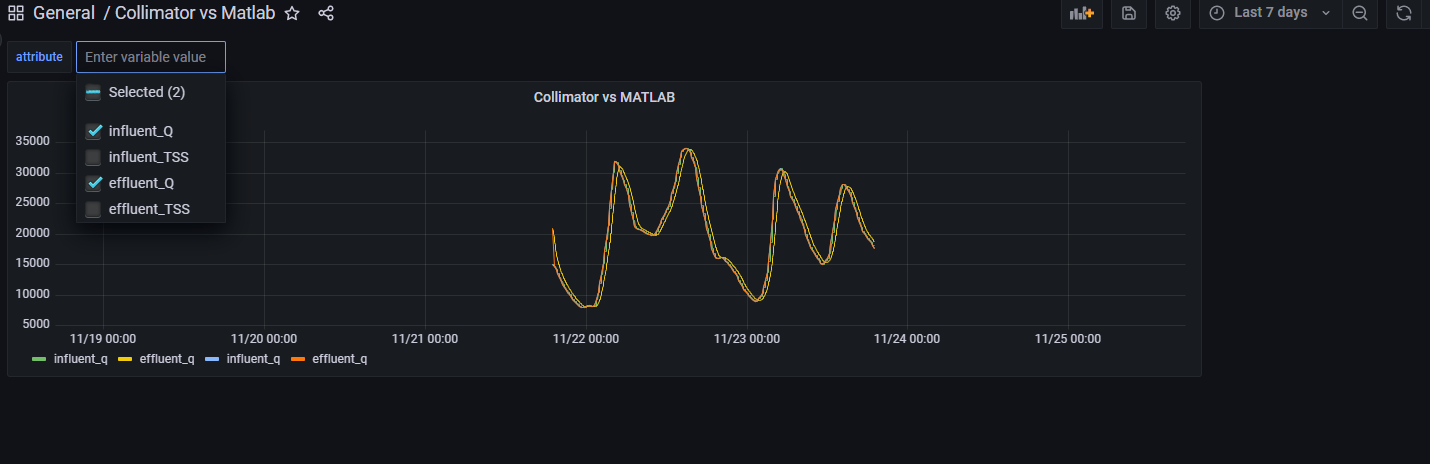
If all good you'll get this dashboard. Make sure you use the correct time range to see the data.
Exporting grafana dashboard
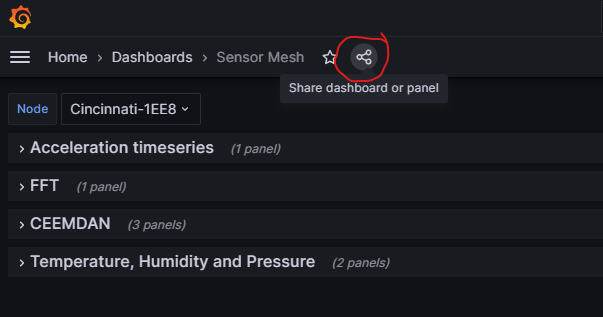
Goto your dashboard and select the share icon
In the popup window, select
Export. TickExport for sharing externallyand clickSave to file.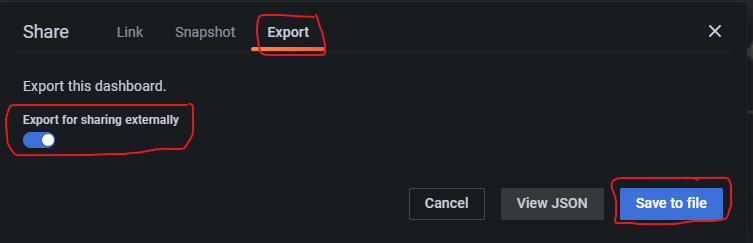
The saved JSON file can be imported to any Grafana instance. It will have the option to select the
Datasourceduring the import process.
Setting up Grafna Alerts
Add alert conditions
- Goto your grafana dashboard (local or cloud). Menu items and icons can be slightly different based on the Grafana version you use. But the steps should be similar.
- Select
Alerts>Alert rules>Create Alert Rule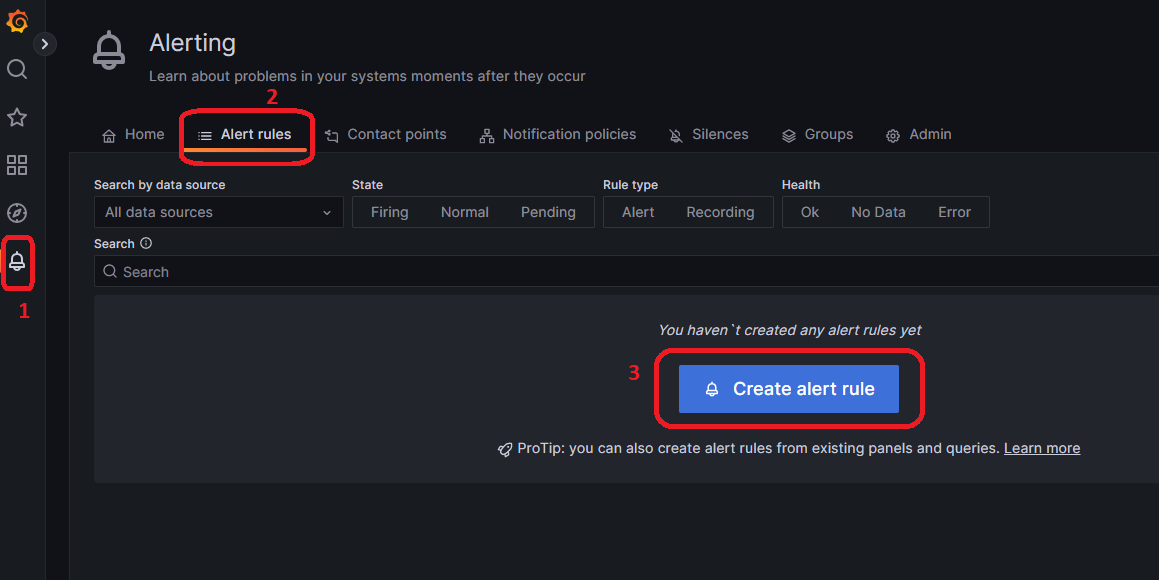
- Give a name to the rule. For example,
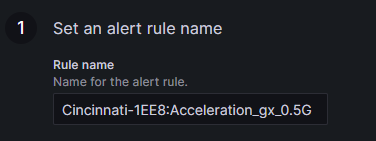
- Setup the SQL query to obtain the data to run the rule on. You should see data on the table after setting the marked fields. Change the sql based on the node mac id.
select ts, amplitude_gx from sensor_mesh.node_0c_b8_15_81_1e_e8_accel_latest where ts > $from and ts < $to;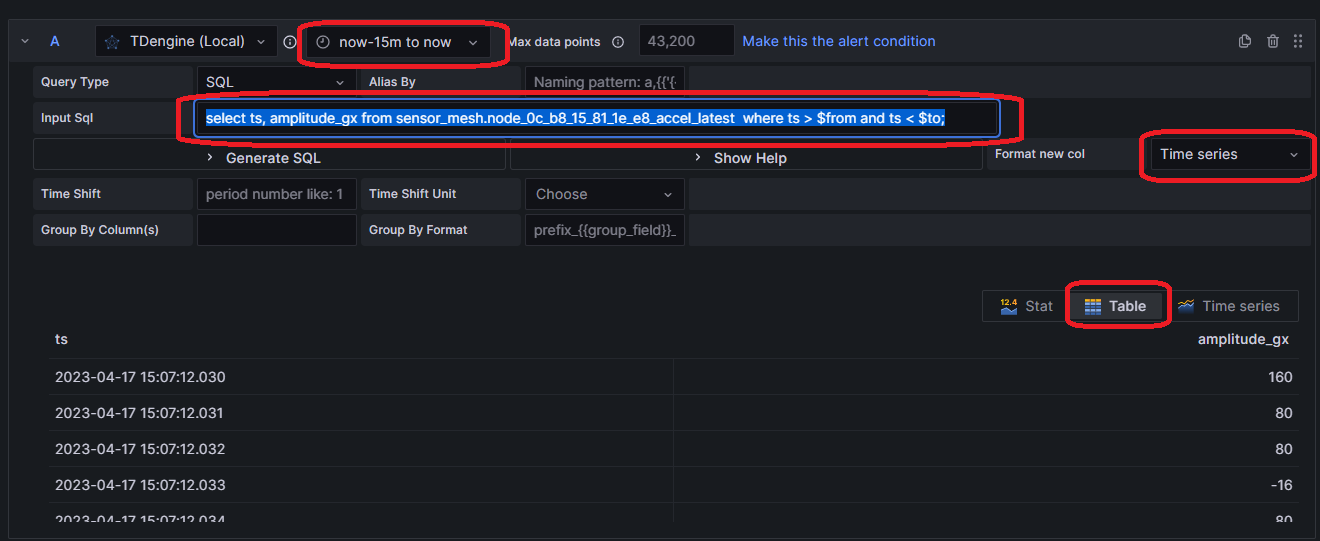
- Then compare the max amplitude of the value series with the threshould as following.
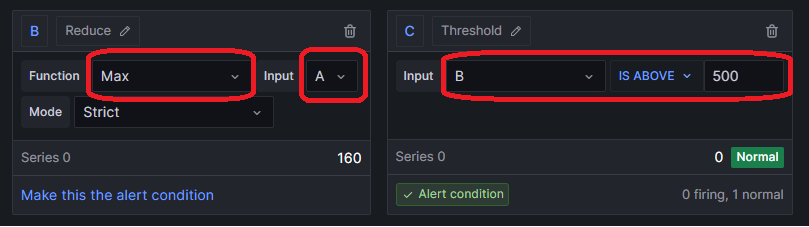
- For
Alert Evaluation Behavior, Select a folder (if this is the first time you are setting up an alert, create a folder to save them into. Give the folder a name likeDemo Alerts. And similarly create a group and name it likeDemoGroup)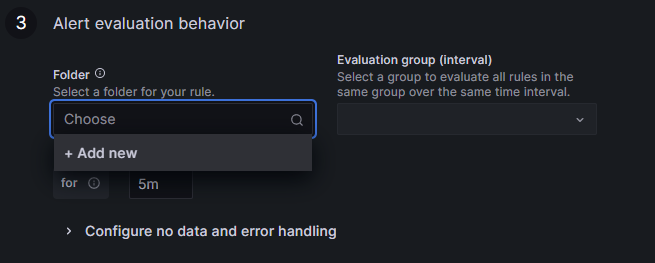 Set up the rest of the fields in this section as below
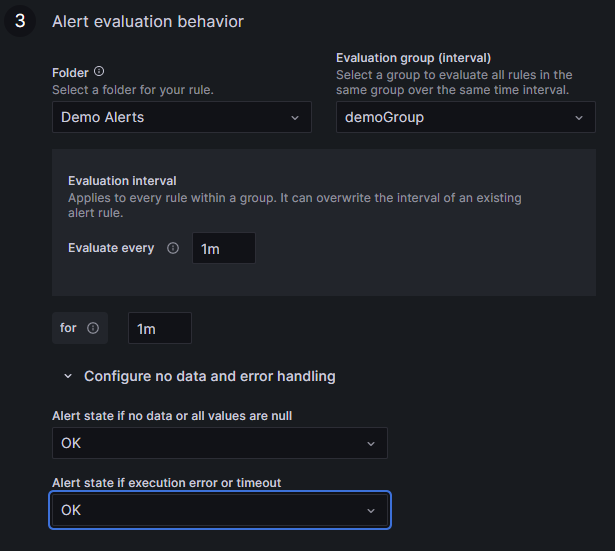
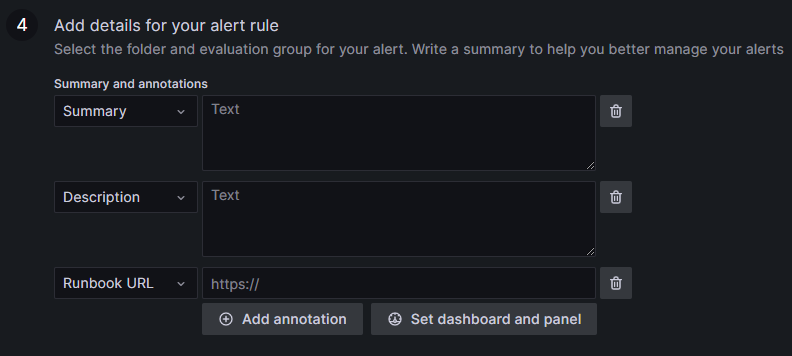
- Add details as necessary. For now I'll leave them as blanks.
- In
Notificationssection, select the appropriate key (or add new key if doing for the first time) and values
- Click
Save, and you'll see the new rule in theAlertspage. It will show you the state of the alert as of now.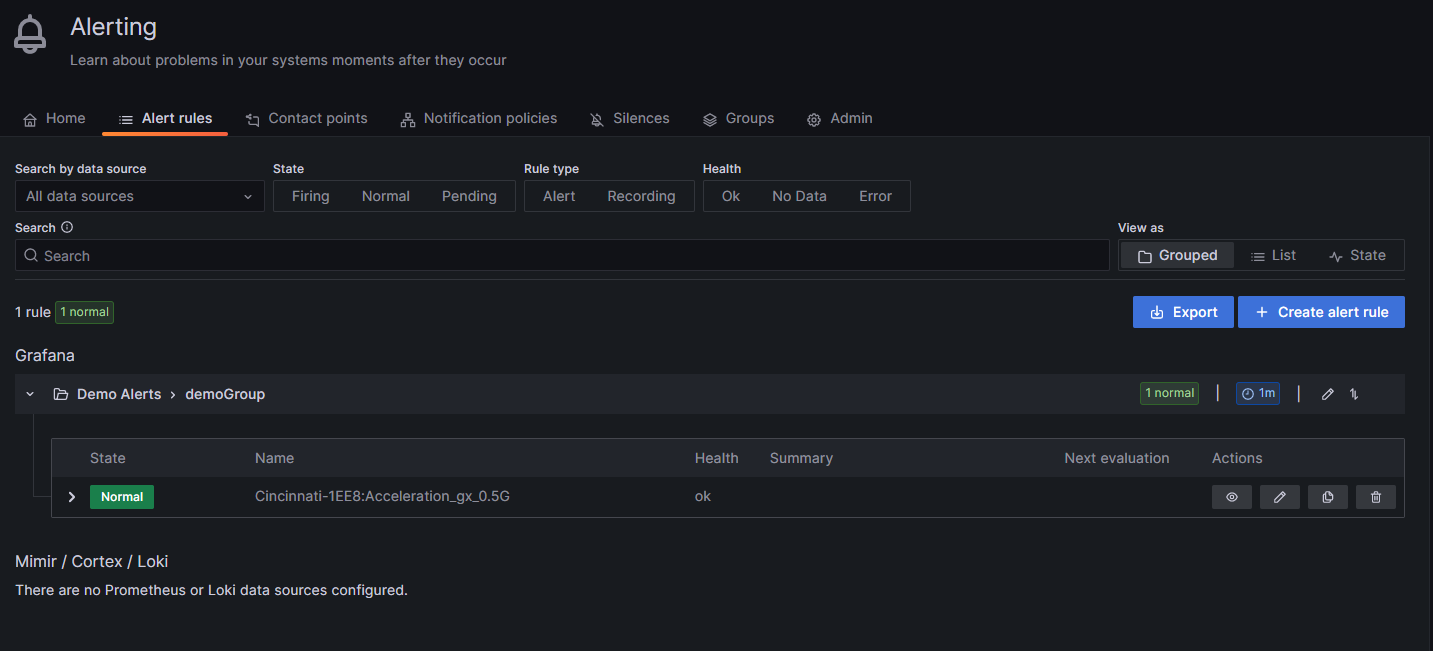
Setup the contact points
Contact points are where we will be sending the alert emails.
Grafanacloud doesn't require any additional configuration as it has it's own mail server to send email alerts. WithGrafanalocal installation we have to add details of our own SMTP server for email alerts to be sent. Following topic describes how to setupSMTPserver on localGrafana.
Setting up SMTP server
Only required for local
Grafanainstallations. Not required forGrafanacloud. Reference: How to setup grafana email alerts
Free Gmail SMTP service might be stopped soon as they are phasing out less secure app access. Currently the Gmail SMTP server access is obtained using a workaround using an app password. We need to switch to a future proof SMTP service
For the demo we have created a gmail account to use as our SMTP server.
deepvibegqc@gmail.com
Password: DeepVibe2@22
App password: rearexoiiqktlkit
We have to have the following information for the SMTP sever. The data shown here are for the gmail account,
deepvibegqc@gmail.comwe created.host = smtp.gmail.com:465
user = deepvibegqc@gmail.com
password = rearexoiiqktlkit
from_address = deepvibegqc@gmail.com
from_name = GrafanaOpen the
grafana.iniconfiguration file.sudo nano /etc/grafana/grafana.iniSearch for
[smtp]to find the section corresponding toSMTPsettings. Replace the content with following. Replace the field values if you are using a different SMTP server.[smtp]
enabled = true
host = smtp.gmail.com:465
user = deepvibegqc@gmail.com
# If the password contains # or ; you have to wrap it with triple quotes. Ex """#password;"""
password = """rearexoiiqktlkit"""
;cert_file =
;key_file =
skip_verify = true
from_address = deepvibegqc@gmail.com
from_name = Grafana
# EHLO identity in SMTP dialog (defaults to instance_name)
;ehlo_identity = df_sensor_alert@sealmaticincia.com
# SMTP startTLS policy (defaults to 'OpportunisticStartTLS')
;startTLS_policy = NoStartTLSNot that
;and#are both used to indicate start of a comment in theinisyntax.Restart the grafana service.
sudo service grafana-server restart
sudo service grafana-server status
Add contact points
Goto your Grafana portal. Select
Alertingfrom left menu and then gotoContact Points. ClickAdd contact point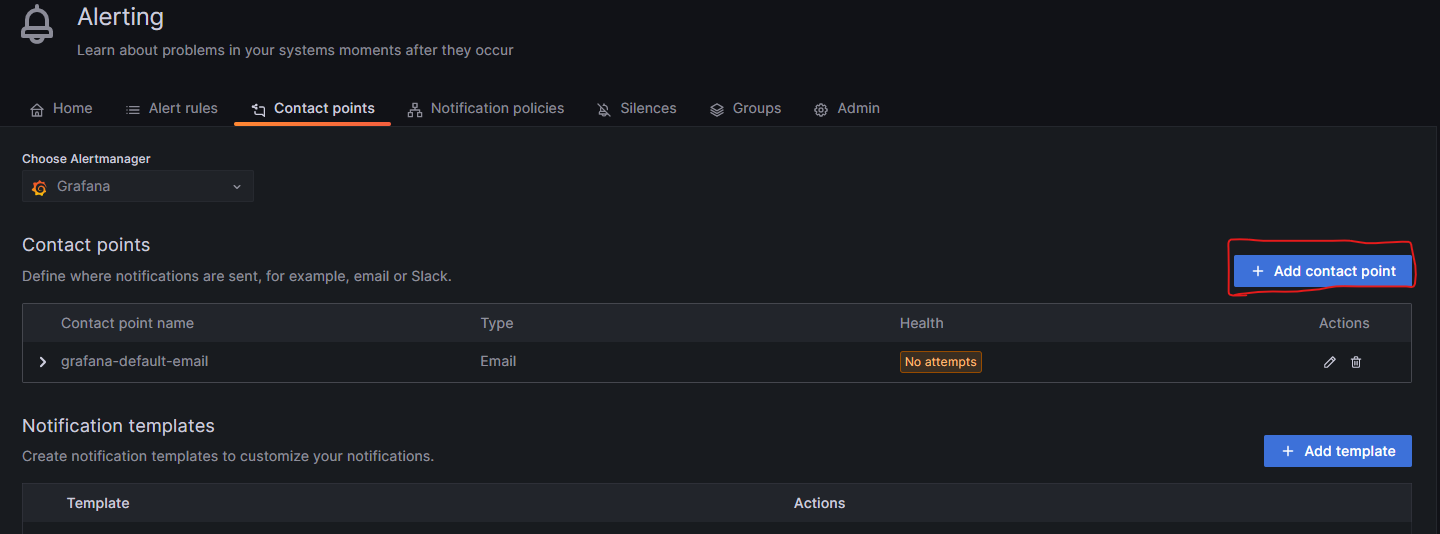
Provide details for the new contact point.
- Give a name to the contact point group.
- Add list of emails where the alerts should be sent in the
Addressesfield, separated by;s. - Click on
Testand see if you are recieved a test email. Checkspamorjunkfolders in your mailbox if the mail doesn't appear in the inbox. - Finally, click
Save contact point.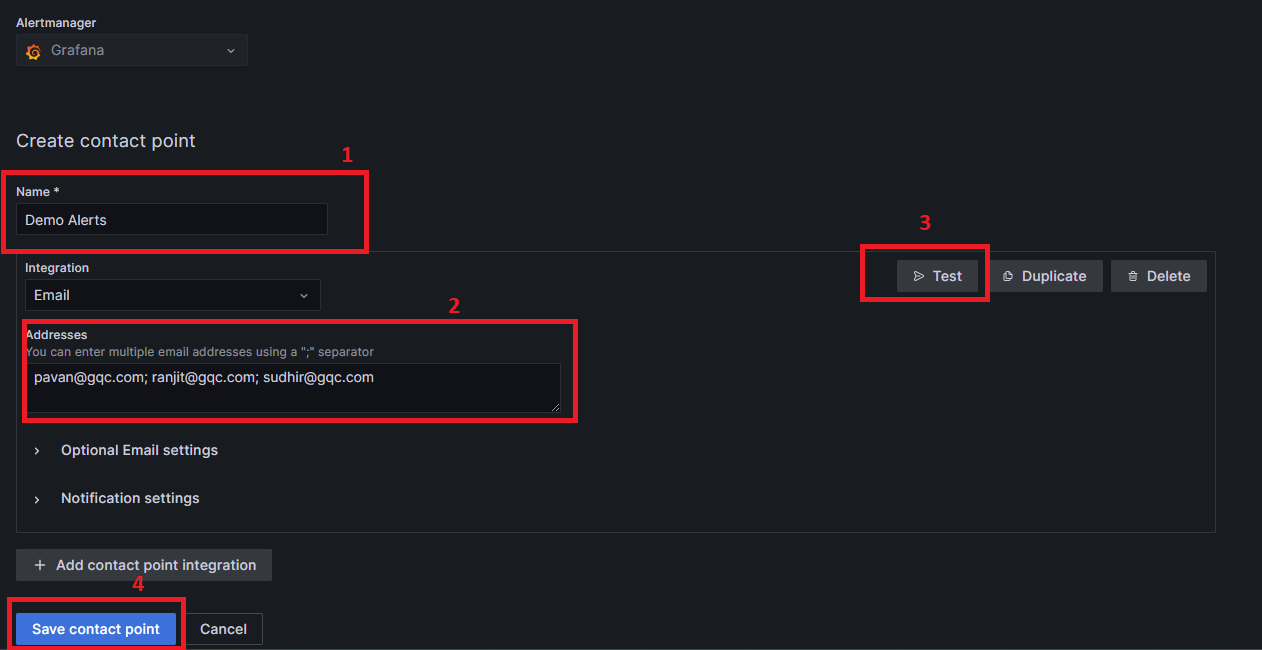
Now you'll see the newly created
contact pointlisted in theContact pointspage.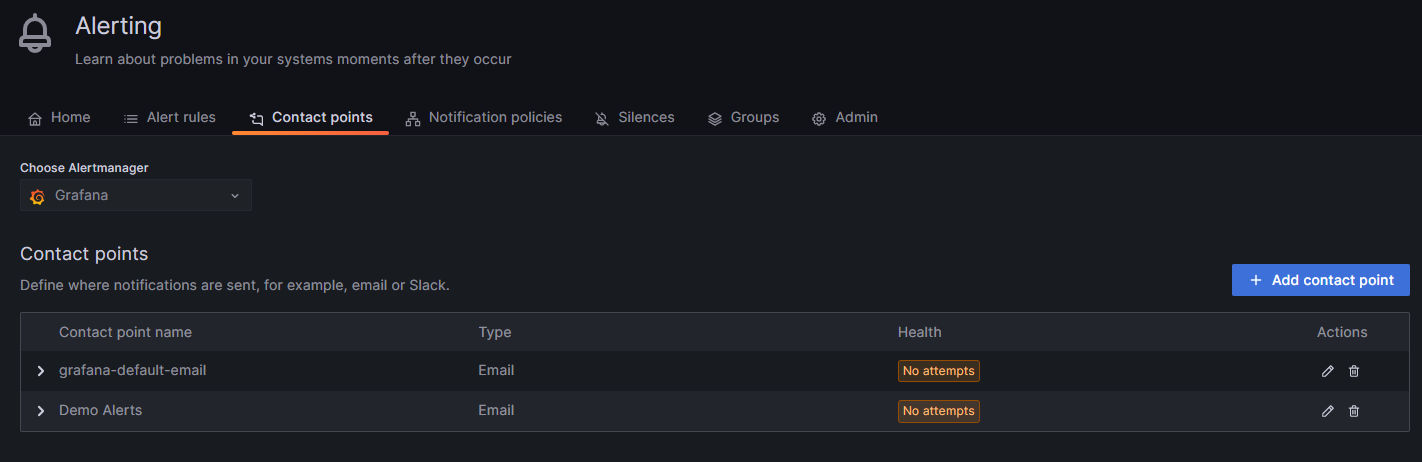
Finally, we have to configure
Grafanato send alerts from our set of rules to the newly createdContact Point.- Goto
Notification policies, underAlerting.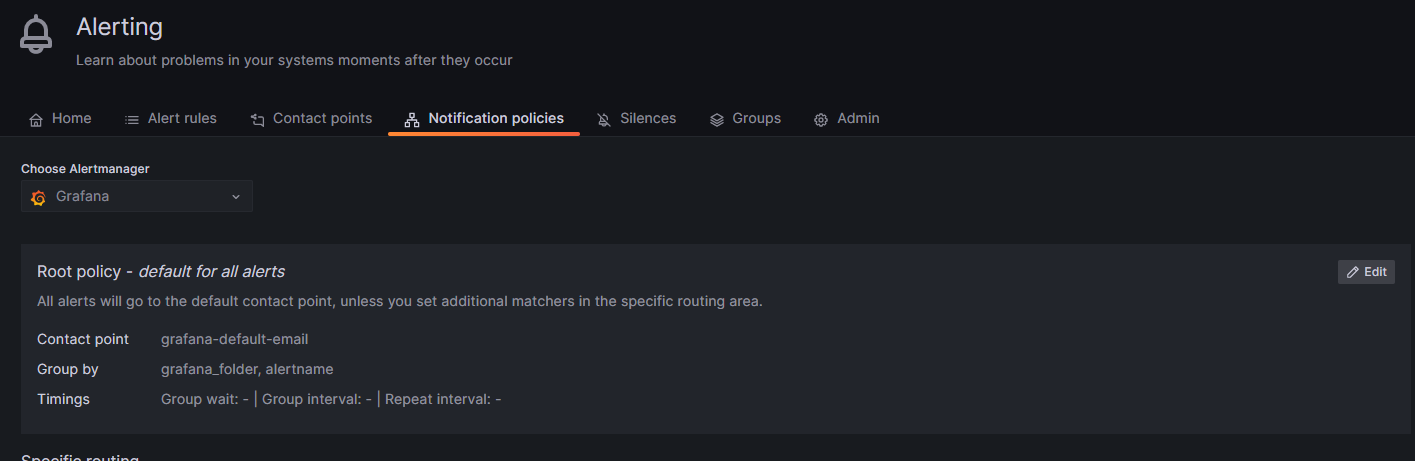
- Click
editbutton inroot policypanel.
- Change the default contact point to the newly created contact point.
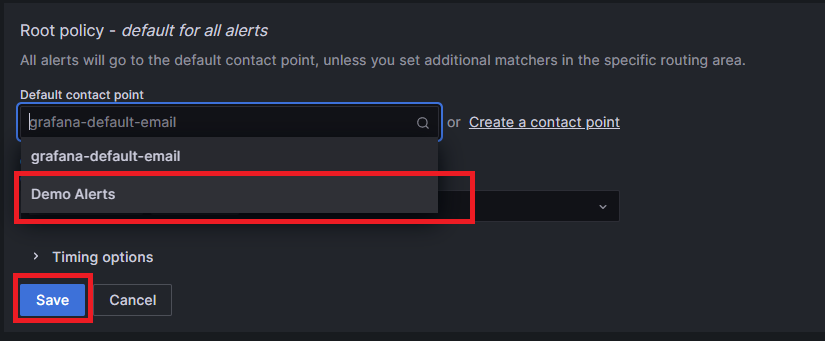
- Goto
Enabling embedded images in the alerts
Created following this article.
On AMD64 Ubuntu machine
When setting up the alert make sure to include dashboard ID and the panel ID
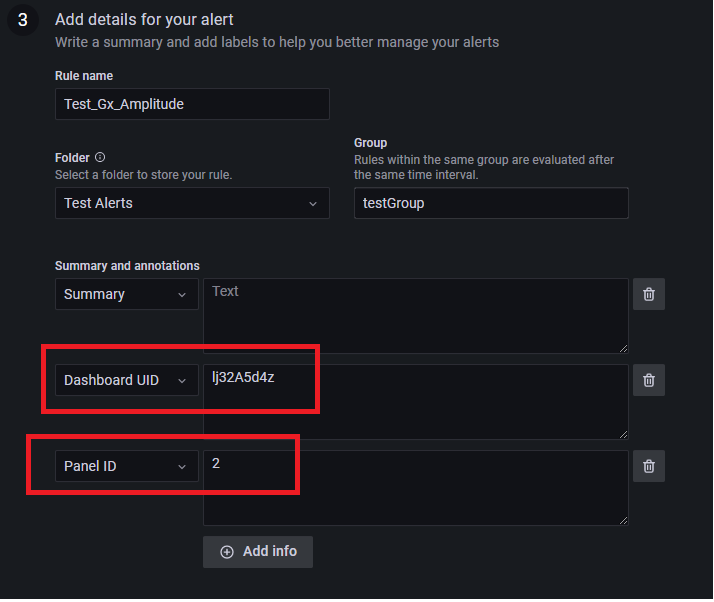
Install the grafana-image-rendere plugin
sudo grafana-cli plugins install grafana-image-rendererIn Grafana config file, enable
unified_alertingand enablescreenshots.- Open the grafana config file.
sudo nano /etc/grafana/grafana.ini` - Search for
[unified_alerting]and uncommentenabledline. So it should look like,[unified_alerting]
#Enable the Unified Alerting sub-system and interface. When enabled we'll migrate all of your alert rules and notification channels to the new system. New alert rules will be created and your notification channels will be converted into an Alertmanager configuration. Previous data is preserved to enable backwards compatibility but new data is removed.
enabled = true - Search for
[unified_alerting.reserved_labels]. Add the following lines above that.[unified_alerting.screenshots]
capture = true - Save and close the grafana config file.
- Open the grafana config file.
Restart the grafana-service
sudo systemctl stop grafana-server
sudo systemctl start grafana-server
The resulting alerts would look like this:
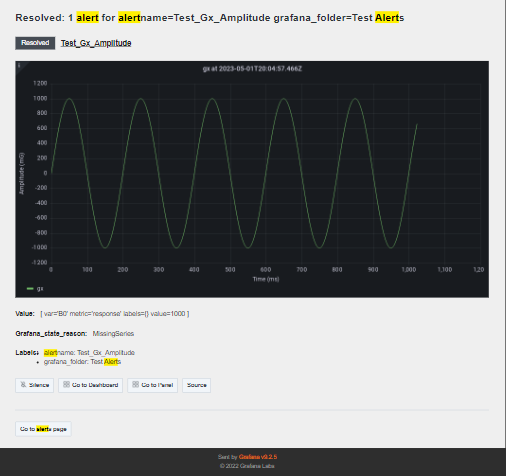
On ARM64 (Raspberry-Pi)
Couldn't get the workaround to run. Leaving the notes here in-case we want to follow up in future.
Tried direct installation of the
image-renderplugin. Not supported forARM64
Followed a workaround:
Create a new directory in
git/public/grafana-renderRun the following commands.
sudo su
wget https://nodejs.org/dist/v16.18.0/node-v16.18.0-linux-arm64.tar.xz
tar xf node-v16.18.0-linux-arm64.tar.xz
cd node-v16.18.0-linux-arm64
cp -R * /usr/local/
git clone https://github.com/grafana/grafana-image-renderer
npm install --global yarn
apt install chromium-browser
cd grafana-image-renderer
/usr/local/bin/yarn install --pure-lockfile
/usr/local/bin/yarn run build
Run the grafana server
node build/app.js server --port=8081Add the following lines to the
[rendering]section of/etc/grafana/grafana.ini[rendering]
server_url = http://localhost:8081/render
callback_url = http://localhost:3000/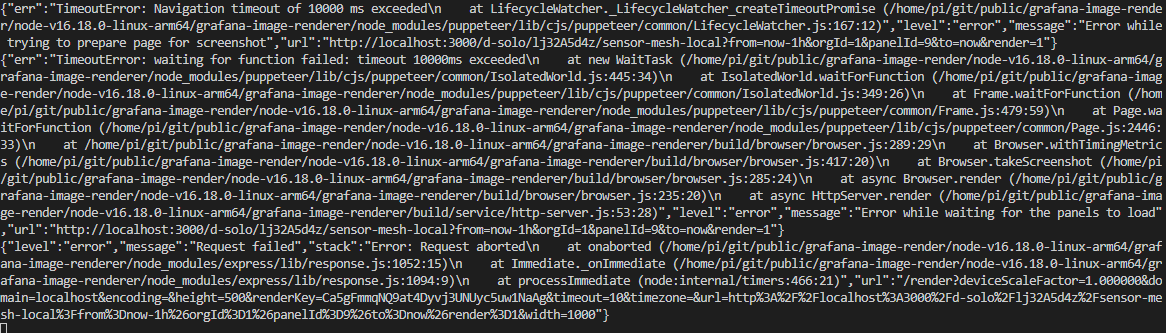
Resetting Grafana Password
In case the login password is forgotten, following method can be used to reset the password. Reference
cd ~/git/gqc/linux_socket_app/grafana_config
sudo grafana-cli admin reset-admin-password admin