Training results
SD1 D dataset
No hyperparameter turning was done
- Wandb logs for single stage run: wandb link
- Wandb logs for two-stage run: wandb link
DNV
A custom model to do binary classification on I&I
- A dataset was found from Vannary's previous runs:
train_dnv_pacp_791_VB_v3.csvwhich I assume to be training data from 791DNVvideos. Corresponding test data is also found from the same location. - Modifying the data to have labels for
I&Iand rest asNDresulted in having 3% ofI%Ilabels from all data. Script path iscompute-msi/sewer_ml/data_preprocessing_scripts/group_labels_into_I&I.py - Dataset was balanced out by dropping
NDdata to matchI&Icount. Final training dataset size is 20k. - Vannary provided a tarball of the training files she used. Extracted that to
/media/gqc/T7/downloaded_cctv_files/dnv/train/and modified the training script to read the images directly from that location. - Find the wandb log here.
- Results:
batchsize = 12
epochs = 10
---------------------------------
order the labels displayed in dls
[False, True]
---------------------------------
f1 validation score = [0.98875256 0.98848168]
f2 validation score = [0.9914898  0.98569489]
Prediction results of this model on different datasets
See where it failed on the test data which is 20k samples from DNV_791 with
I&IandND50:50 ( You had started on that).Loaded them into the Visualization app. Reviewed with Sudhir.
Run it on EBMUD entire dataset and see if it detects any I&I frames.
ND: 20367I&I: 569
Sudhir reviewed them through streamlit app.
Run it on rest of the DNV data (it should say no I&I).
ND: 320139I&I: 2927
Accuracy: 99.09% prediction output file: /home/gqc/git/gqc/compute-msi/sewer_ml/prediction_csv/cctv-first-stage-dnv_pacp_791_VB_v3_I_and_ND--predictions_for_dnv_complement.csv
false positiveimages are ready to be viewed in the streamlit if needed.Run it on COV data.
COVframes are in zips. Reading from zips for inference require looking into fastai API futher. To get faster results on this exercise, I thought of extracting the zips (around 100 videos) to a temp directory and running the inference.Total frame count: 76029
False predictions total: 21792
- `FP`: 21260
- `FN`: 532
Can see results on streamlit
Visualizationapp.
Run this on available
WRcframes.There are ~250 GB zip files with corresponding frames. I can follow the same method used for COV. Extracting the frames to a temp directory and running the prediction.
infoExtracting 250GB worth of data (from ~100 zips) took 24.25 hours.
Prediction results:
ND: 757553I&I: 4779
Ready to be viewed through streamlit
Visualize the
I&Idefects on GIS.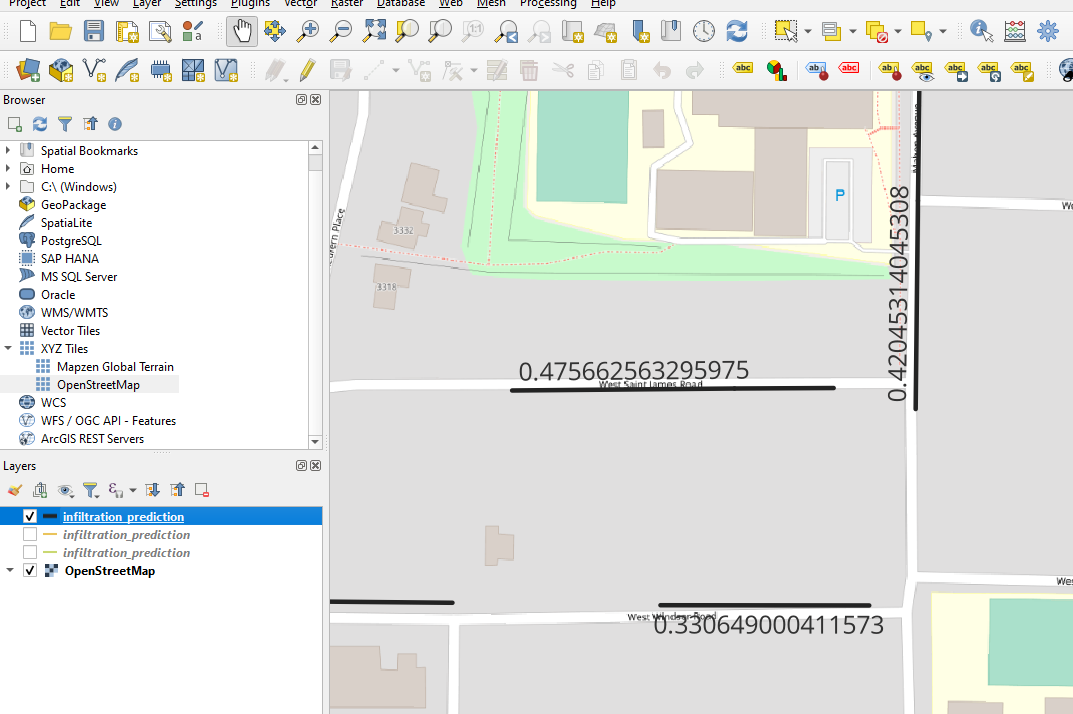
- Visualize the current defects on QGIS -> There should be an existing script. Look into what Srujana has done.
- Found the corresponding notebook section and integrated that in the docs. Importing the resultant shape files and adding some simple visualization tweeks get us this result:
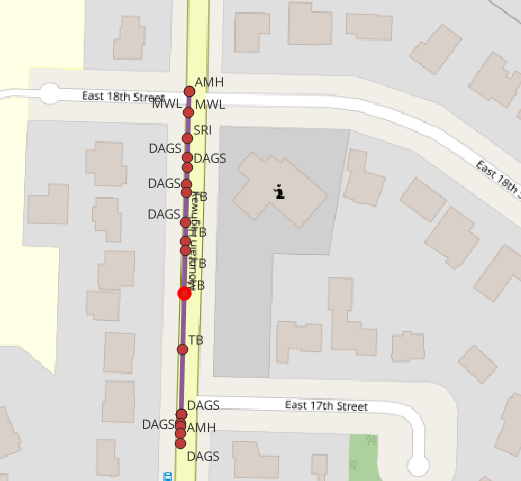
- Found the corresponding notebook section and integrated that in the docs. Importing the resultant shape files and adding some simple visualization tweeks get us this result:
- Visualize the current defects on QGIS -> There should be an existing script. Look into what Srujana has done.
Redo this for "Roots" instead "I&I" (train with DNV data). I think you were looking into it.
DNV WRc dataset Blurred Frames for 1066
WRcare available.1650WRcvideos are not used for anything. Can createI&Igroups based on Vannary's answers and train a new model forWRc.