Questions
02/02/2024
- Pavan: What different settings are supported and tested with different algorithms?
Vannary:
internal_cat= use the algorithm's internal function to handle categorical variables. When I developed the model, LightGBM, CatBoost, and XGBoost (only the experimental version) algorithms had functions to handle categorical variables.- In paper 2, interal_cat == True for both LightGBM and CatBoost and interal_cat== False for XGBoost and RF.
Other settings:
- Set polar_coord = True if you want to train and test the model using the polar coordination of the point centroid.
- Set polar_coord = False if you want to train and test the model using the x and y coordinates of the point centroid.
- Set internal_cat == True if you want to use the algorithm function to handle categorical variables.
- Set internal_cat == False if you want to use a one-hot encoder for data preprocessing to handle categorical variables.
- selected_cols_y = list of defects you want to model to predict. If you have multiple defects and you want to group them into one super defect group, set
group_predicted_y= True. - For example, I grouped C, F, B, DF, X, and H into the structural defects supergroup for Paper 2.
11/28/2023
What are contained in each of these files and how were they created? Are they direct exports from metadata DB or CSV files?
cctv_header = pd.read_csv('/content/drive/MyDrive/VS_Research/CCTV/DNV/Data/condition_data_csv/CCTV_Headers.csv')=
cctv_detail = pd.read_csv('/content/drive/MyDrive/VS_Research/CCTV/DNV/Data/condition_data_csv/dnv_B_C_condition_data_with_remarks_col.csv')
cctv_detail_full =pd.read_csv('/content/drive/MyDrive/VS_Research/CCTV/DNV/Data/condition_data_csv/CCTV_Details_sorted_by_jobnumber_distance_code_edit.csv')
cctv_header_81 = pd.read_csv('/content/drive/MyDrive/VS_Research/CCTV/DNV/Data/condition_data_csv/pipe properties/combined_pipe_properties_84videos.csv')
cctv_detail_81 = pd.read_csv('/content/drive/MyDrive/VS_Research/CCTV/DNV/Data/condition_data_csv/dnv_pacp_A_81_condition_data.csv')

list_81_videos = pd.read_csv('/content/drive/MyDrive/VS_Research/CCTV/DNV/Data/condition_data_csv/DNV_PACP_81videos_edit.csv')
list_videos = pd.read_csv('/content/drive/MyDrive/VS_Research/CCTV/DNV/Data/condition_data_csv/DNV_PACP_711_out_5238videos.csv')Vannary:
- We received the first batch of 81 videos and 3 access database files from Sean in 2022. The two files correspond to
cctv_header_81andcctv_detail_81were created by importing tables from the three access database files. Refer to project/CCTV AI/metadata.md from the project website for more information. - The rest of the videos along with the two DBF files were uploaded to
January 2023 DNV uploadfolder by Sean. Refer to project/CCTV AI/metadata.md from the project website for more information.cctv_headerwas extracted from CCTV_Headers.dbfcctv_detail_fullwas extracted from CCTV_Details.dbfcctv_detailwas extracted fromcctv_detail_fullto only include the condition data of the PACP videos
list of 81 videoscontains the list of video names that were first uploaded by Seanlist_videoscontains the list of PACP videos that were uploaded toJanuary 2023 DNV uploadfolder and have corresponding cctv condition report found in theCCTV_Details.dbf.(These videos were used to develop multi-label defect classification model)- FYI: I used all the CCTV condition reports from the
CCTV_Detailsto develop models for predicting infiltration and structural defects. Some of the reports do not have matching video files. Refer toVS_Research/CCTV/DNV/Data/condition_data_csv/list_730_PACP_videos_in_CCTV_Details.csvfor the full list of PACP cctv condition reports found in theCCTV_Details
- We received the first batch of 81 videos and 3 access database files from Sean in 2022. The two files correspond to
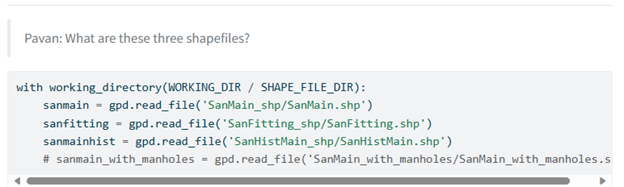
What are these shape three shapefiles?
Vannary::
sanmainis a polyline shape file of DNV sanitary mains.sanfittingis a point shape file of DNV manholes.sanmainhistis a polyline shape file of DNV abandoned sanitary mains.
Creation of remarks column.
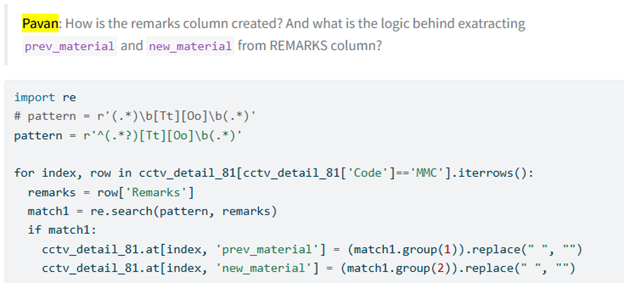 Vannary: Remarks column was extracted from the
 CCTV_detailor condition reports. Remarks column is used by inspector to enter additional information such as when pipe material changes during inspection.Code
MMC.
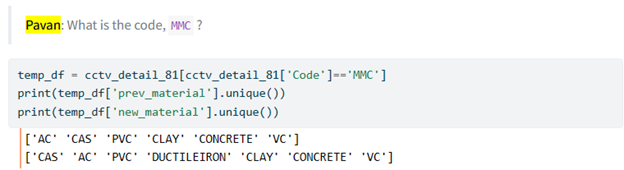
Vannary: MMC = Material changesubheader_df
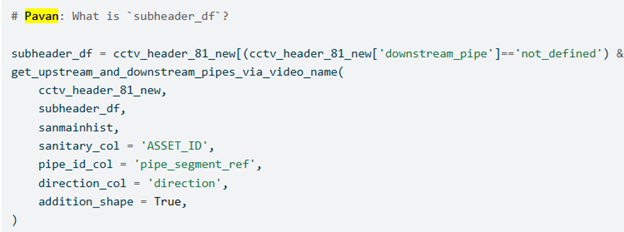
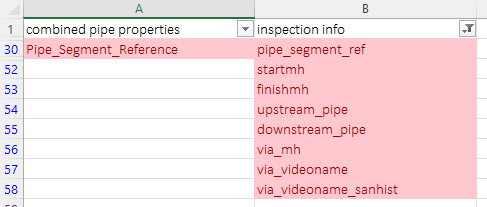
Vannary: I createdsubheader_dfwhen I want to only apply certain function to rows that meet specified conditions.This is the diff between the columns of 'cctv_header_81` and the output csv, 'inspection info' which is used by DNV A dataset. Can you give a brief on what these new columns contain?
Vannary:
pipe_segment_ref- list of pipe id being surveyedstartmh- starting manhole (the name of the manhole at the beginning of the survey).finishmh- finishing manhole (the name of the manhole at the end if the survey)upstream_pipe- pipe id located at the most upstream point of the survey (not always the same as the starting pipe).downstream_pipe- pipe id located at the most downstream point of the survey.via_mh- if this is equal to 1, the upstream and/or downstream pipes of this cctv condition report is extracted by using manholes shape files.via_videonameif this is equal to 1, the upstream and/or downstream pipes of this cctv condition report is extracted from the video file name and found a matching pipe id insanmainshape file (only work if the video file name is named after the pipe segment )via_videonameif this is equal to 1, the upstream and/or downstream pipes of this cctv condition report is extracted from the video file name and found a matching pipe id insanmainhistshape file (only work if the video file name is named after the pipe segment )
What were the differences between DNV A and DNV B, C datasets which made you define two sections to process them?
Vannary: See question 1.
11/17/2023
Some more questions for further clarity.
LightGBM model
The condition data Sean provided for all DNV datasets (which includes DNV A, B, C and WRc 1066, WRc 1650) were used for the lightGBM model?
Vannary The cctv inspection reports for DNV A videos were obtained from the access database provided by Sean in 2022, while DNV B, C and WRc data were obtained from the condition data that Sean uploaded in January 2023. However, the condition data does not include all the CCTV inspection reports of the DNV B, C, and WRc videos.You had to compare water level code to identify the standard from PACP and WRc for each inspection because the metadata did not say which standard they are using?
Vannary: That is correct.Did you use datasets from any other utility than DNV for the lightGBM model training or prediction? If yes, can you share the location containing the results from those runs?
Vannary:- I also used the DNV and Metro datasets, namely Utility A and Utility B.
- The results are stored in this folder
- Each model ran on 20 sets of testing data (computed from repeatedstratifiedkfold) to generate the average area under (AUC) the curve.
- The Mann-Whitney U test, a non-parametric statistical test, is used to compare any two sets of AUC-ROC (area under the ROC curve) generated for any two classification models. The distribution of AUC-ROC between the two models are found to be different if the p-value, a probability value that describes how likely they are to be the same, is less than or equal to a specified significance level, e.g., 0.05 in this study. If the models are considered to be different the U statistic, may be used to determine the relative performance of the models, i.e., the model with the larger U statistic is considered to be the better model.
- I did same process for both ROC and precision and recall (PR) curves.
- Copy of compare_mean_pr_curve_fix_alg.csv has the results of comparing the area under the PR curves (AUC-PR) of the three different approaches for handling imbalanced data for each algorithm.
- Copy of compare_mean_pr_curve_fix_tech.csv has the results of comparing the AUC-PR of the four algorithms for each handling imbalanced data technique.
- Copy of compare_mean_roc_curve_fix_alg.csv has the results of comparing the area under the ROC curves (AUC-ROC) of the three different approaches for handling imbalanced data for each algorithm.
- Copy of compare_mean_roc_curve_fix_tech.csv has the results of comparing the AUC-ROC of the four algorithms for each handling imbalanced data technique.
11/16/2023
- What are the best model types identified by the research on random tree based methods?
Vannary: LightGBM with oversampling (SMOTE) method is the best for I&I models for both utilities, and lightGBM with class weight is the best for structural models for both utilities.
10/12/2023
Pavan
What was the research conclusion? Did you find which model type and which hyper-parameters worked best for the Utilities you ran this through? Or if there is a written documentation on the flow, that will be helpful to us too. Vannary: I am working on this. I have saved the optimal hyperparameter for each algorithm and resampling method in the pickle files. (https://drive.google.com/drive/folders/1-FxAPvJhCmVO_7W_yzdhvhMDqGHTbUW4) The hyperparameters vary depending on which defect you want to predict and which algorithm you are using.
Preprocessing the labels.
What the reason behind excluding these labels?
exclude_pacp_codes = ['TB', 'TBC', 'TBA', 'TBB', 'TF','TFC', 'TFA', 'TFB', 'TR', 'TRC', 'TRA', 'TRB', 'TS', 'TSC', 'TSA',
                    'ISSR','ISSRB','ISSRH','ISSRL','ISGT','ISZ','LD','LL','LLD','LLU','LR','LRD','LRU','LU',
                    'ACB','ACO','ACOM','ACOP','ACOH','ADP','AEP','AJB','AM','AMH','AOC','ATC','AWA','AWW','AZ',
                    'MCU', 'MGO', 'MGP', 'MJL', 'MLC', 'MMC', 'MSC', 'MSA','MWL', 'MWLS', 'MWM', 'MY', 'MYV', 'MYN',
                    'GTP', 'GTPJ', 'GTPL', 'GTF','GTFJ', 'GTFL', 'GTU', 'GTUJ', 'GTUL', 'GRT',
                    'OBB','OBC','OBI','OBJ','OBM','OBN','OBP', 'OBR','OBS','OBZ',
                    'VR','VC','VZ'
]Vannary: Those labels are labels related to construction features and miscellaneous features such as type of tap, general observation, water level, etc. I only include defective labels.
2 .How are group_1 and group_2 labelling schemes derived? What is the basis used for grouping in each of these schemes?
Vannary: PACP codes usually consist of two or three letters. The first letter describes the defect types (crack (C) or root (R)), the second letter describes the distress level of the defect (such as CL for longitudinal Crack and RF for find roots), and the third letter describes the location or other additional description of the defect (RFJ for fine root at joint). Group 1 is the group of codes that have similar code when you are reducing the code by one letter and group 2 is the group of codes that have similar code when you are reducing the code by two letters. If the original code has two letters, its groups 1 and 2 will be the same. For the WRc codes, I only match the code to group 2 of the PACP code.
Questions about the models that are being trained.
- Do you train any multi-class multi-label models?
Vannary: I am still training a binary model. - In the 'else' clause above, you derive a new single label column to be used in binary model training by grouping the selected_cols_y into Structural_defect_I. Am I missing anything?
Vannary: I make two defect prediction models: 1) for I&I and 2) for structural defect such as crack, fracture, broken, hole, deformed, and collapse). For the structural defect model, I grouped those codes into one predicted label (y = structural defect). It is still a binary classification model.
- Do you train any multi-class multi-label models?
10/11/2023
Pavan
Has the research outputs been finalized? Vannary: The research outputs have been finalized. I am working on writing the paper 2 right now.
What are the final notebooks you used for this project?
Vannary: Here are the links to notebooks related to defect prediction model:
- To create the model: colab notebook
- This is the version 2. I added pipe length and polar coordinates as additional features. You can switch between using x,y coordinates and polar coordinates by setting polar_coord to False or True.
- To compile the results: colab notebook Compute the confusion matrix at decision threshold = 0.5 and the optimal threshold obtained from the ROC curve Plot ROC curve.
- To generate SHAP values and partial dependence plots : colab notebook
- To create the model: colab notebook
10/02/2023
Pavan
- In the 3 algorithm comparison notebook, you are not using shap for visualizing the data. Are we not using
shapanymore?
Vannary: I am going to plot the shap values in the separate notebook after finding the optimal parameters for each model. I use plot the shap values to find the feature importance of each model. F1 score of positive label and AUC are the two metrics that I used to evaluate the model performance so far.
09/27/2023
Pavan
What are the key indicators you use to compare results? Vannary: I used the F1 score of '1' or 'positive' label and roc-auc to evaluate the best model. The F1 score of '0' is generally high, and the F1 score of '1' is a lot lower in comparison because the data is imbalanced. ROC-AUC is a good indication as it shows the plot between true positive rate vs. false positive rate between different models. I do not have wandb log for this.
What is meant by 'I&I'? Vannary: I&I stands for inflow and infiltration.
Was there a list of labels that you trained different models with? Or is it just a defect label, 'I'? Vannary
- I have created a new notebook where I trained the model with different algorithms and y-prediction labels. ()
- In addition, I have created a new mapping defect location notebook for METRO.
09/25/2023
Pavan: What are the metrics used to evaluate the models?
Vannary: I used the F1 score of '1' or 'positive' label and roc-auc to evaluate the best model. The F1 score of '0' is generally high, and the F1 score of '1' is a lot lower in comparison because the data is imbalanced. ROC-AUC is a good indication as it shows the plot between true positive rate vs. false positive rate between different models. I do not have wandb log for this.
09/19/2023
Mailed Vannary with below questions.
Can you please specify what sections we need to run and what not to run from these? Refer Fig 1 for the notebook outline.
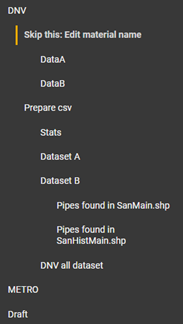
[VS] Run all the cell inside DNV section. You can skip
Skip this: Edit material namesection if you already have the same standard name for pipe material. For example, CP for concrete pipe. Run this cell and edit the cells in this section if you multiple name for the same pipe material. For an example, both Con and CP stand for concrete pipe.Can you specify from which notebook are the shape files, refer below, that we are importing in prepare_data_for_defect_prediction_version_2, generated from? We checked the
mapping_defects_version_2.ipynbfor output files with same names but couldn’t find them.defect = gpd.read_file('/content/drive/MyDrive/VS_Research/CCTV/DNV/GIS/shapefiles/defect_location_version_2DNV_81_pacp_defect_points_material_edit.shp')
all_codes = gpd.read_file('/content/drive/MyDrive/VS_Research/CCTV/DNV/GIS/shapefiles/defect_location_version_2/DNV_81_pacp_code_points_material_edit.shp')[VS] These two files are outputs from running
Skip this: Edit material name section. I added this section because the output frommapping_defects_version_2notebook did not have the standardized material name. I am not sure if I have fixed this issue in themapping_defects_version_2notebook.Below is the dataflow diagram that we constructed based on our understanding of the notebook. Can you confirm if it’s, correct?
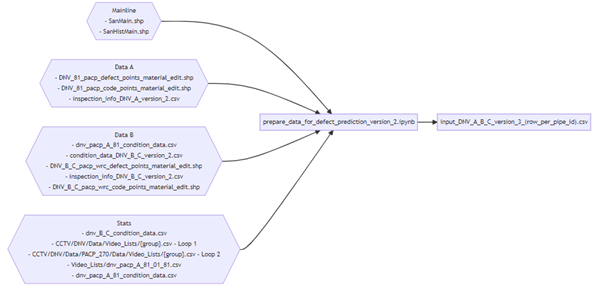
[VS] The material edit shape file is created in prepare_data_for_defect_prediction_version_2 notebook. The output from mapping_defects_version_2 notebooks are:
    defect = gpd.read_file('/content/drive/MyDrive/VS_Research/CCTV/DNV/GIS/shapefiles/defect_location_version_2/DNV_81_pacp_defect_points.shp')
    all_codes = gpd.read_file('/content/drive/MyDrive/VS_Research/CCTV/DNV/GIS/shapefiles/shapefiles/defect_location_version_2/DNV_81_pacp_code_points.shp')
09/14/2023
Information from the meeting with Vannary:
Is there a name for the project?
- No formal title is used.
- This project has two parts:
- Mapping the defect locations to GIS
- Models based on each label to predict the likelihood of defects (binary) in a pipe given the pipe details.
Any documentation on it? Not at this point
Related repos?
No github repos. The work is contained in notebooks. These are the related notebooks which are not cleaned.
Is there a WandB project to track the runs?
Nope